# Validating a business case / building a model
Going into this phase, at times the requirements are very tightly defined or there is a bit of play to find the best way to solve the problem. Either way there tends to be a few universal challenges to getting from data to a model that can deliver business value.
# Challenges
- Data issues need to be discovered ASAP as they can take time to resolve
- Until you build the solution end to end you don’t know all the data, knowledge and assumptions needed
- Invalid assumptions can change everything so they need a lot of focus
- As you uncover more constraints results tend to get worse
- Clients / stakeholders don’t like to see results getting worse
- Valid test sets and KPIs are hard to get right before the problem is fully understood
- Once the client sees any results it can bias their view and make agreeing KPIs and test structures harder
Here we’ll dive into the Kortical process that mitigates these challenges and how the platform accelerates delivering a high performing data science solution.
# Our model building process
# Overview
- Verify the data
- Understand the data & problem
- Agree KPIs
- First result - show them what you’ve got so far
- Iterate: validate or improve
- Results session / sign-off
Typical timeframe: 4 weeks
Typical team:
- Data-scientist (commitment 100%)
- Senior consultant data-scientist (commitment 20%, 8 hours weekly)
- Domain knowledge stakeholder (commitment 7.5%, 3 hours weekly)
- Data access stakeholder (commitment 7.5%, 3 hours weekly)
- Sign-off stakeholder (commitment 2.5%, 1 hour weekly)
- App developer (commitment 0-100%, problem dependent)
# Verify the data
Where possible we ask the business to send over the data prior to commencement of the project. There are two main reasons for this:
- They often find the data is harder to source than anticipated and this stops us having people blocked out, doing nothing. Scheduling the project after the data is verified helps to mitigate this.
- We can see if we can spot any immediate data issues and get those issues fixed before kicking off the project in earnest.
There are two main platform features that will help accelerate this.
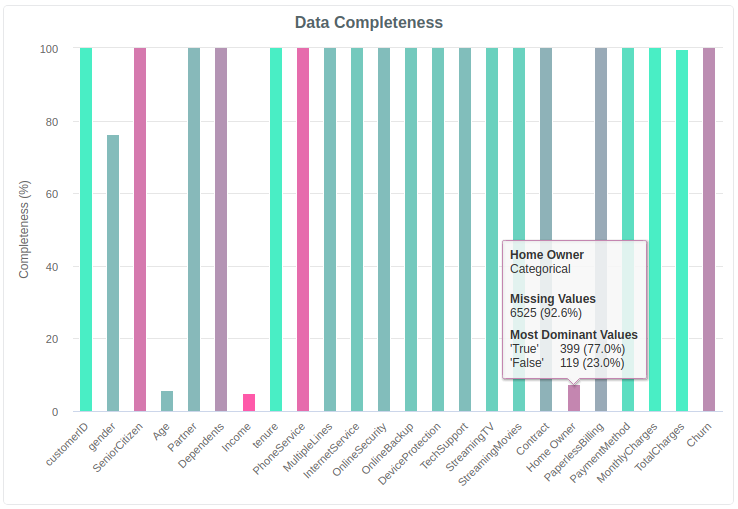
# Data completeness
Use Data Completeness to check if the data looks as expected. One of the common surprises for many businesses is how sparse user-entered demographic information can be. You can spot these columns on the chart where the height of the bar is not 100%.
Another common pitfall is default values making a column look full when it’s not. To find these look for the pink columns where you would expect a lot of value diversity.
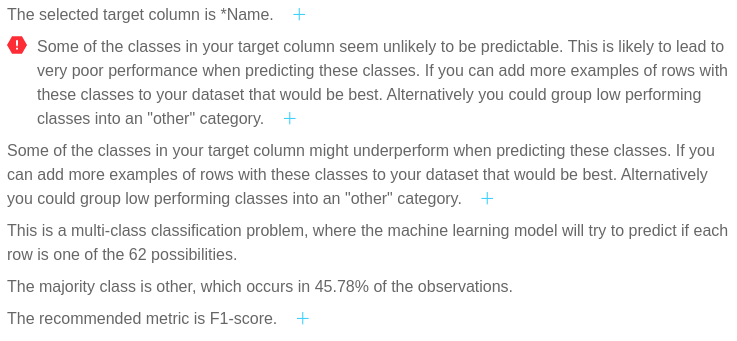
# Target insights
Another common data issue for multi-class or multi-label model building where there are a lot of labels, is that there are often classes that are underrepresented in the dataset. To spot these we can look at the Target Insights section. The platform will call out specific classes that look like they’ll be hard to predict and you can ask the client for more data, or get them to agree to merge low frequency classes into an 'other' category.
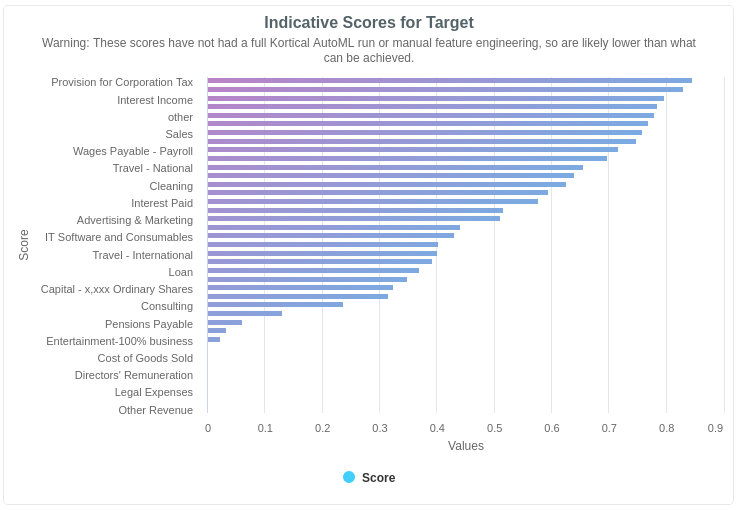
If the indicative model scores in the Target Insights look lower than you would expect at this point, it may be worth taking a closer look or re-evaluating the business case with the revised down accuracy to see if it still makes sense.
# Understand the data & problem
We start with a two hour kick-off session where we explain our process, the domain experts explain the business problem and the data-scientists can ask questions. The sign-off stakeholder should provide direction and the project is officially underway.
Many datasets are distributed over multiple files and require several aggregations. We would typically use a Jupyter notebook for this and each iteration can be checked in the platform as described above in Verify the Data and we work with the customer to fill in any blanks or shed light on things that are unclear.
As soon as we have data that can be used to make a model, we run the AutoML. You can see a guide to model creation here. This gives us a great basis to know where we’re at in terms of model performance, which without the platform would not be easy to do at this stage.
The two major things we want to identify in this race to first model are:
- All the data assumptions we are making and get the domain experts to validate them.
- How tractable is the problem - if we have a high performing model we know the focus needs to be around validation that the results are real; if the results are low then we know the focus needs to be on additional data and feature engineering to improve the model.
Particularly if the model results are a little underwhelming, it can be very tempting to start to improve model performance at this stage. However, we try to go end to end on the business case before starting model iteration. For example, if we’re predicting customer churn, we calculate what would be the revenue impact of the churn model over the current baseline. This helps us find any other missing data or assumptions we need to verify early on.
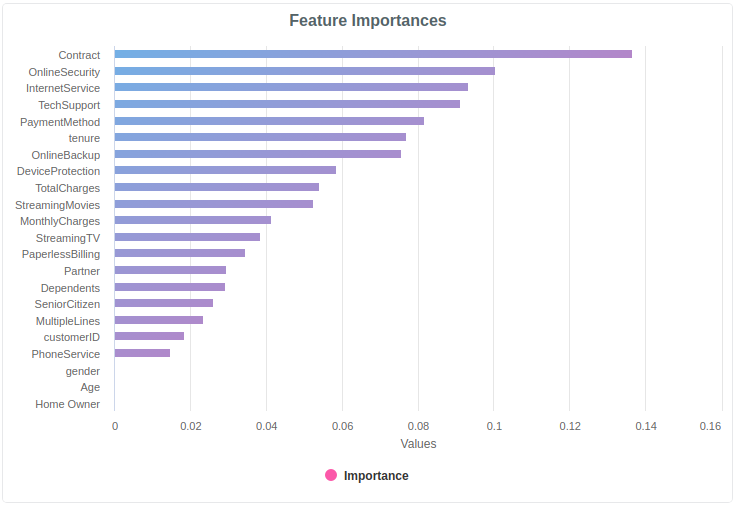
Talking through the model-agnostic feature importances can be a good way to sense check if the data is behaving as they might expect.
We typically keep a held-back test set and validate the model via API as described here.
# Agree KPIs
At this point we hope to have:
- Verified we have all the data we need for the project
- Validated our assumptions with the domain experts
- Built the first end to end pass of the solution and have a good idea of likely project outcomes
- Figured out a sensible test set for model validation
This puts us in a strong position to agree solid, achievable KPIs for the project that best show the business impact of the project. By way of example, we might agree that the key KPI to optimize is the increased revenue from reducing churn measured on a held-back test set which contains the most recent 6 months of data.
The platform would recommend Area Under the ROC Curve (AUC) as the model evaluation metric to select the best model for predicting if the customer would churn or not, which is a heavily skewed binary event, but we’d be free to change to another metric. The subsequent transformation from AUC to a real dollar value would happen in the notebook.
# First result - show them what you’ve got so far
During a four week project we set up calls twice a week to help answer data questions and clarify any understanding. By the mid point, if there have been no major curveballs we should be ready to present the first client facing results. We’ve validated all the assumptions in the solution right through to the key KPIs and so are unlikely to have to revise any reported results down as we should have uncovered all the constraints.
# Iterate: validate or improve
Iteration usually goes one of two ways:
- The results are almost too good to be true and the customer wants a lot of proof, or
- The results are not yet great in which case the lion’s share of the effort needs to go into improving the model.
# Iterate: validation
The goal of this stage is often to provide enough evidence of the model performance to allow them to build confidence as they take this project to senior management for approval of the next project phase.
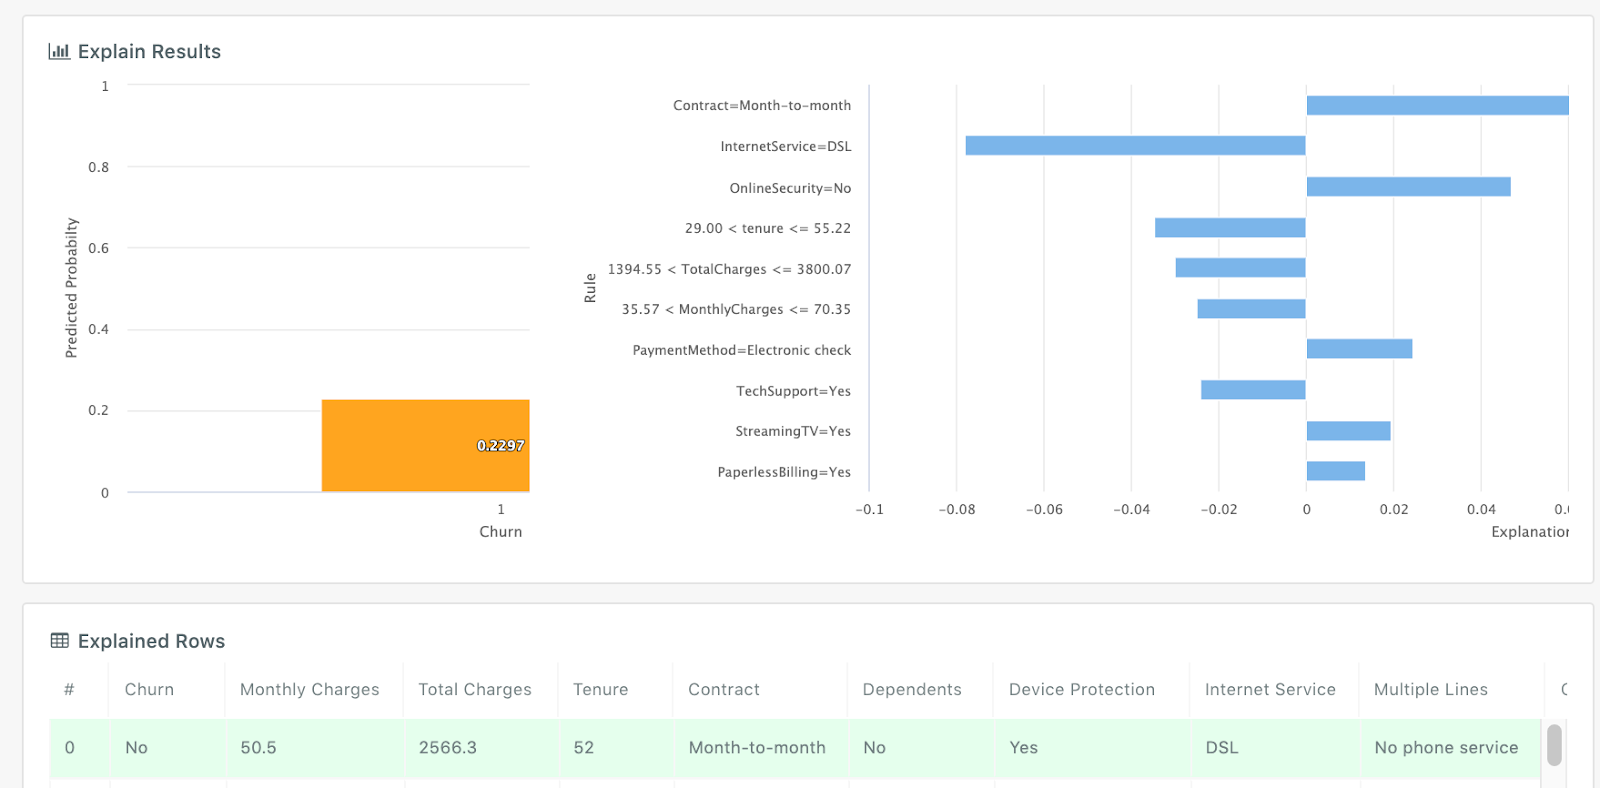
Looking at model-specific feature importances is a key strategy we use to help the customer understand how the machine learning model is making decisions. We often find that models work 95% as expected which builds confidence and the last 5% is really interesting insight.
The help with this process, the platform provides a variety of model explainability features.
- High-level feature importances
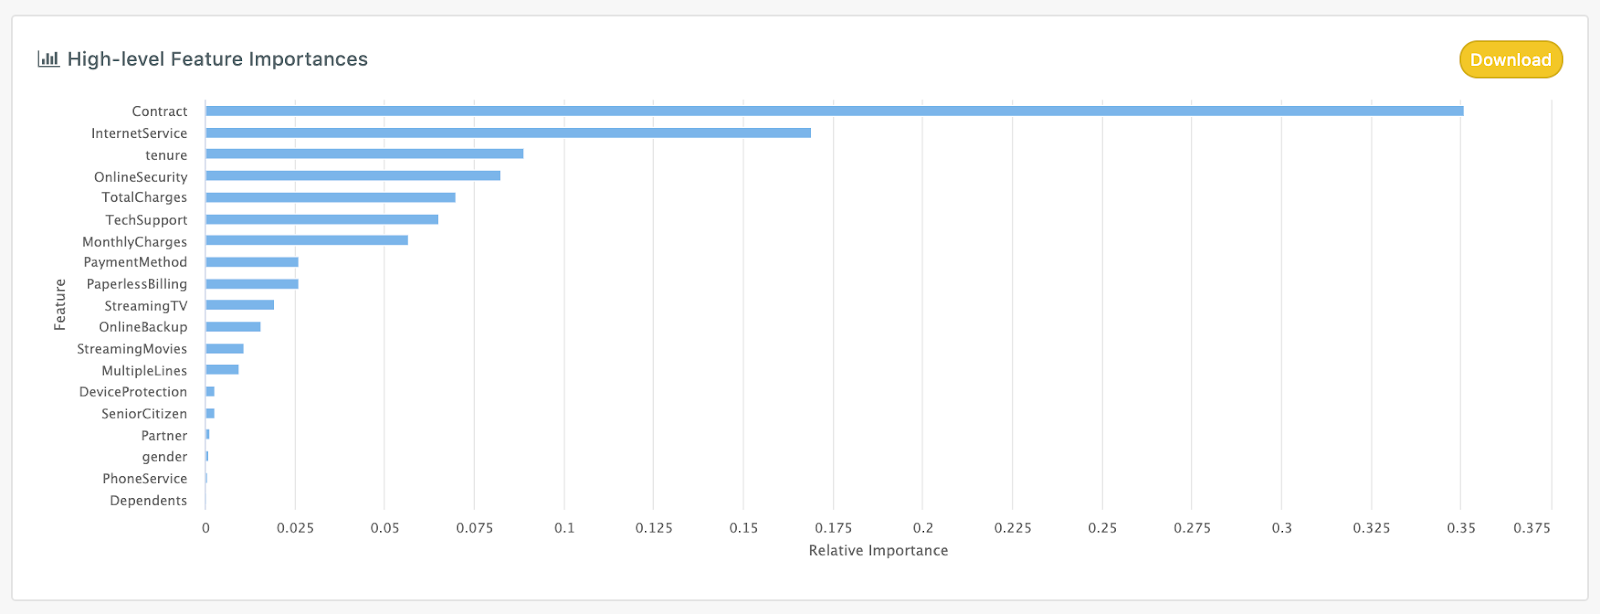
- Low-level feature importances
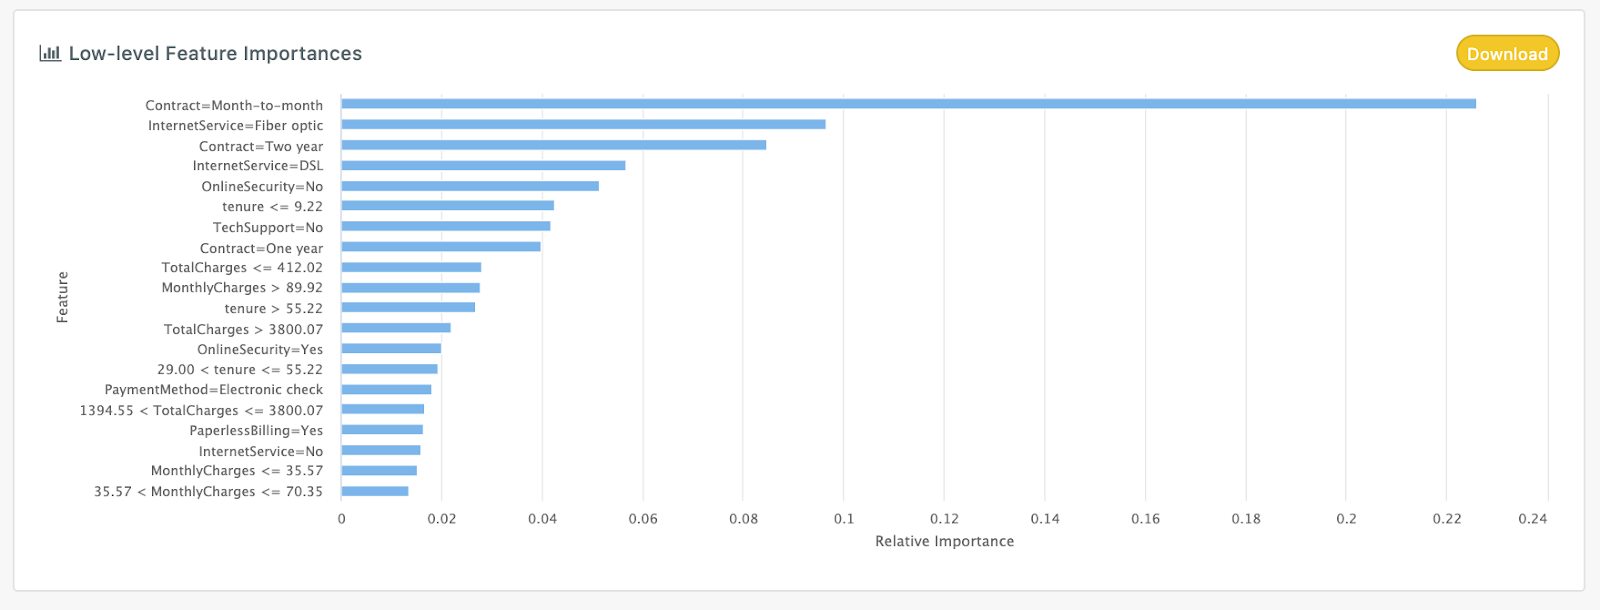
- Row-by-row feature importances
# Iterate: improvement
If we haven’t yet achieved amazing results, we need to improve the model. The steps we take to do this are:
- Check the feature importances for the model
- Work with the domain experts to review incorrect predictions and see if they can:
- Let us know if it’s a case of mislabelling, or
- Explain why this prediction might have been tougher for the model
- Hypothesise features or datasets we can add that might mitigate the issues
- Create the features in the notebook, re-upload the data and build a new model
- If we are confident of the ballpark of the right solution we can use the AutoML code to reduce the solution search space and accelerate iteration time
- Test the results
- Repeat the process till the model achieves the desired results
With larger datasets it can take a couple of days to find the best model, so while Kortical is crunching away we work on new features and validating the previous model. We also sometimes set the dataset fraction to use down 50%, for example, to accelerate iteration and then bump it back up at the end of the project for the final result. See Reduce dataset fraction to use for further details on how to do this.
Another important way of iterating faster is to use Kortical's language to limit the solution search space by customising the default AutoML code.
# Results session / sign-off
Typically we build up a presentation as we complete the various stages of the process so we have a record of findings, understanding and results. This can then be very effective for socialising the details of the project and getting wider support. The results session provides an opportunity for the primary stakeholders to invite a wider group of stakeholders to understand what we did and what was accomplished.
# Summary
While this is our process, Kortical does not restrict you to this process in any way. The ability to validate data and produce end to end solutions quickly, however, does make it much easier to establish a baseline for the client's current process, understand the likely project impact and reduce surprises during the model building process, regardless of the exact process you use.
If you have any questions, please reach out as we are here to help!