# Add Data
The first step in using Kortical is to add a suitable dataset for analysis. Currently data must be uploaded to the platform in CSV format but in the future we intend to support other data sources, such as databases.
# Upload dataset
# Data page
The first page you see after logging in is the data page:
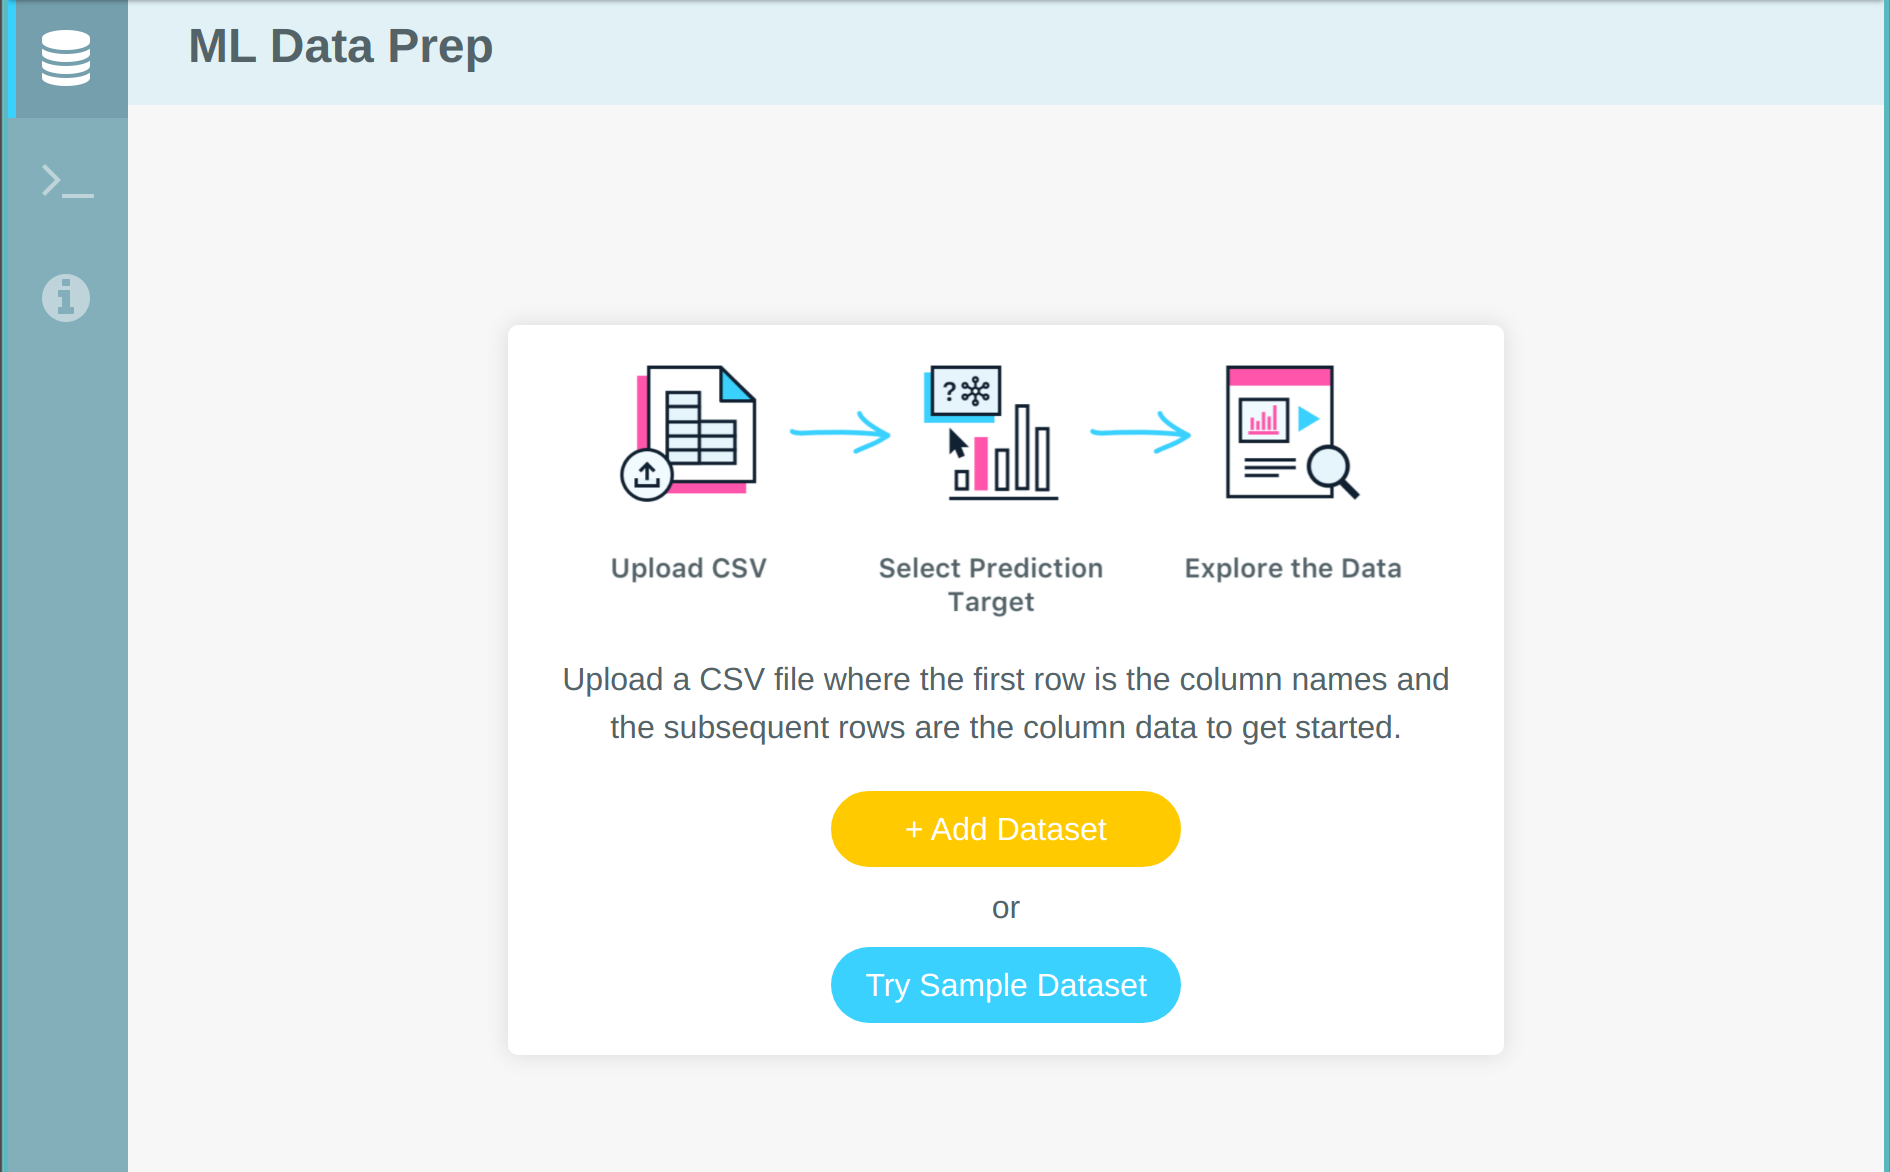
It is also available on the side menu.
# First upload
After clicking on Add Dataset, select the CSV file you want to upload (from disk or another data source):
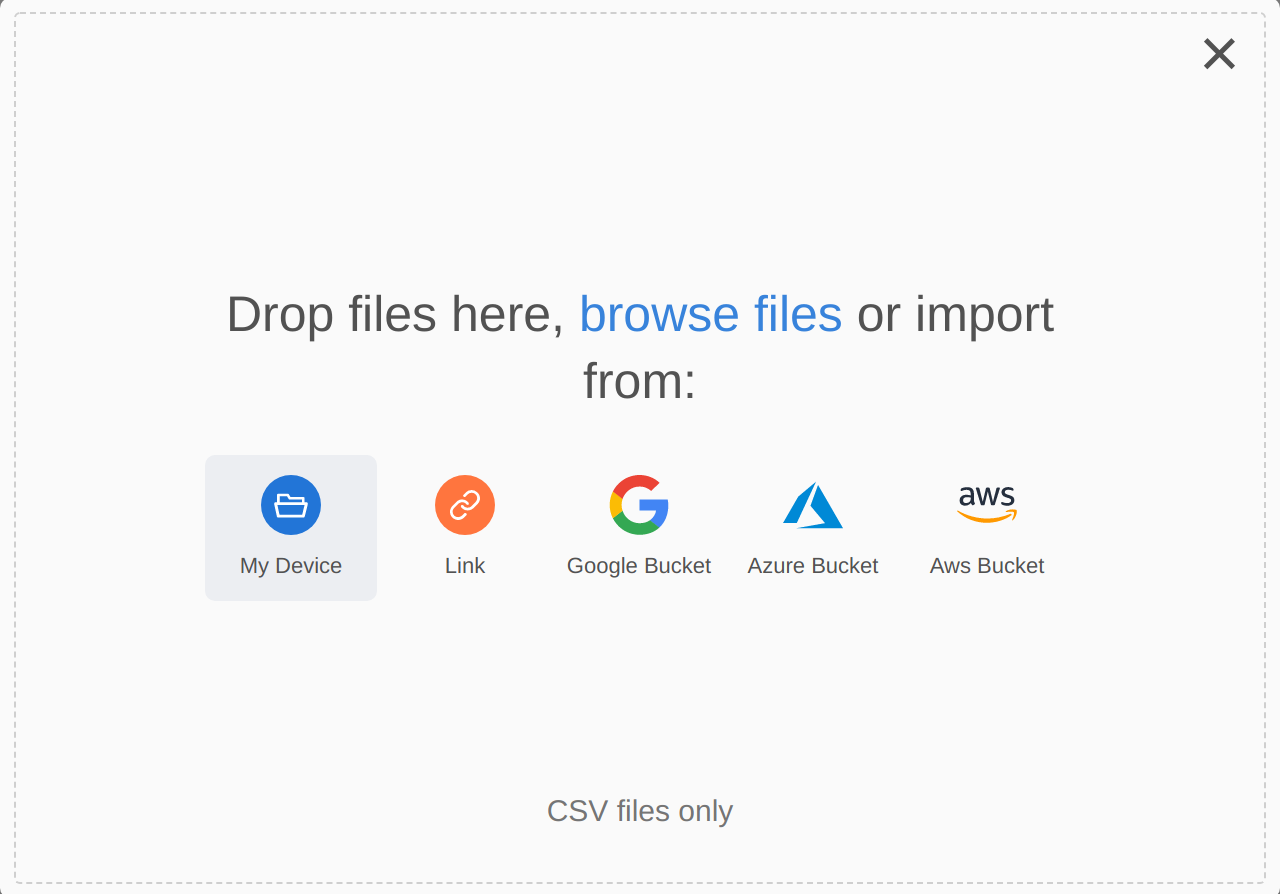
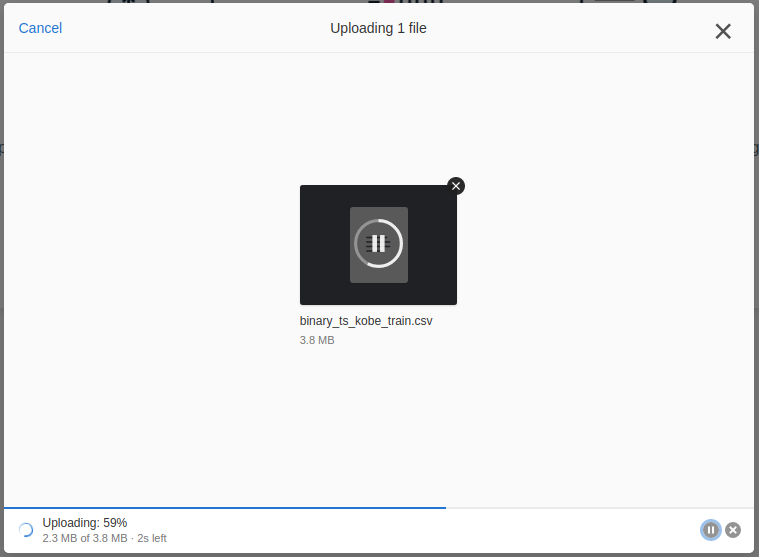
The file will be uploaded to the platform. You can pause and resume uploads, and it will also recover automatically if any intermittent internet outage occurs during the upload. If this is not your first upload, you will need to upload additional datasets using the Data Selector.
# Dataset processing
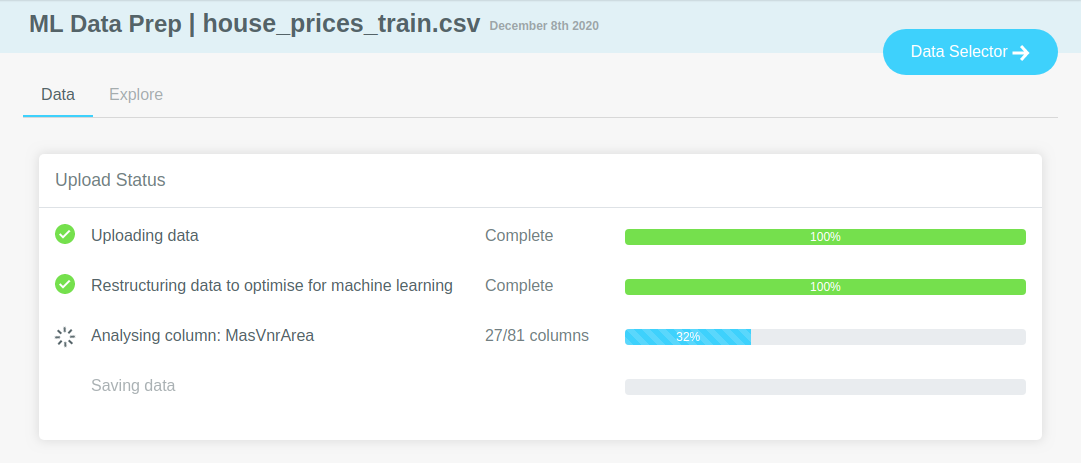
Once the dataset has been uploaded to the platform, we do some initial analysis to extract basic metadata about each column.
# Preparing a dataset for Kortical
In order to train a machine learning model, we need a file to have certain properties and to essentially look like a table.
Each row in the file should be a single observation (measurement) of an event and should contain a set of features and a target.
We expect the first row to be a set of column headers that contain the feature names, so ensure no blank rows are present at the top of your file. We also expect the file format to be a CSV file (but aim to support more formats very soon).
As an example of a simple case, consider the following dataset:
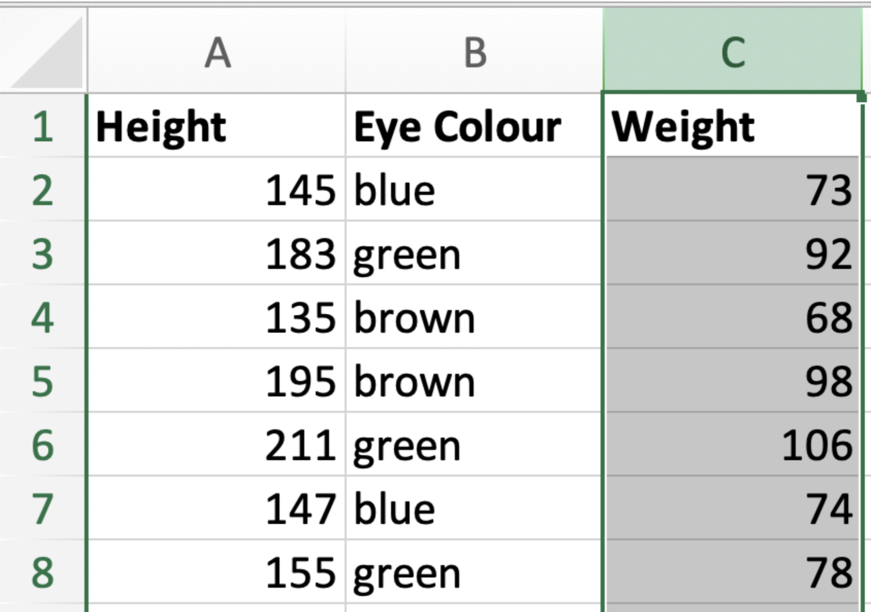
Let’s say that here we are trying to predict Weight from Height and Eye Colour. Our target would then be Weight
and our input features are Height and Eye Colour.
Not all the features might be relevant for predicting our target, so Kortical also offers feature selection in the form of MPLE which can help tell you which features you can drop (maybe Eye Colour isn’t that useful here!).
This general pattern extends to pretty much every machine learning problem. The input features can contain a number such
as with Height, a category such as Eye Colour but these cells could equally contain free text, such as the contents of an email.
The more features (columns) you add, the more observations (rows) you need for machine learning to work properly. There is no fixed ratio for this as it is highly problem-dependent, but a good rule of thumb is to aim for at least 10x the number of rows to columns.
If you are solving a multiclass/multilabel problem, you should probably multiply this again by the number of classes. So if you had 10 columns and are predicting 10 different classes you would want at least 1k observations (if observations are uniformly distributed between classes, more if they are imbalanced).
# Data view
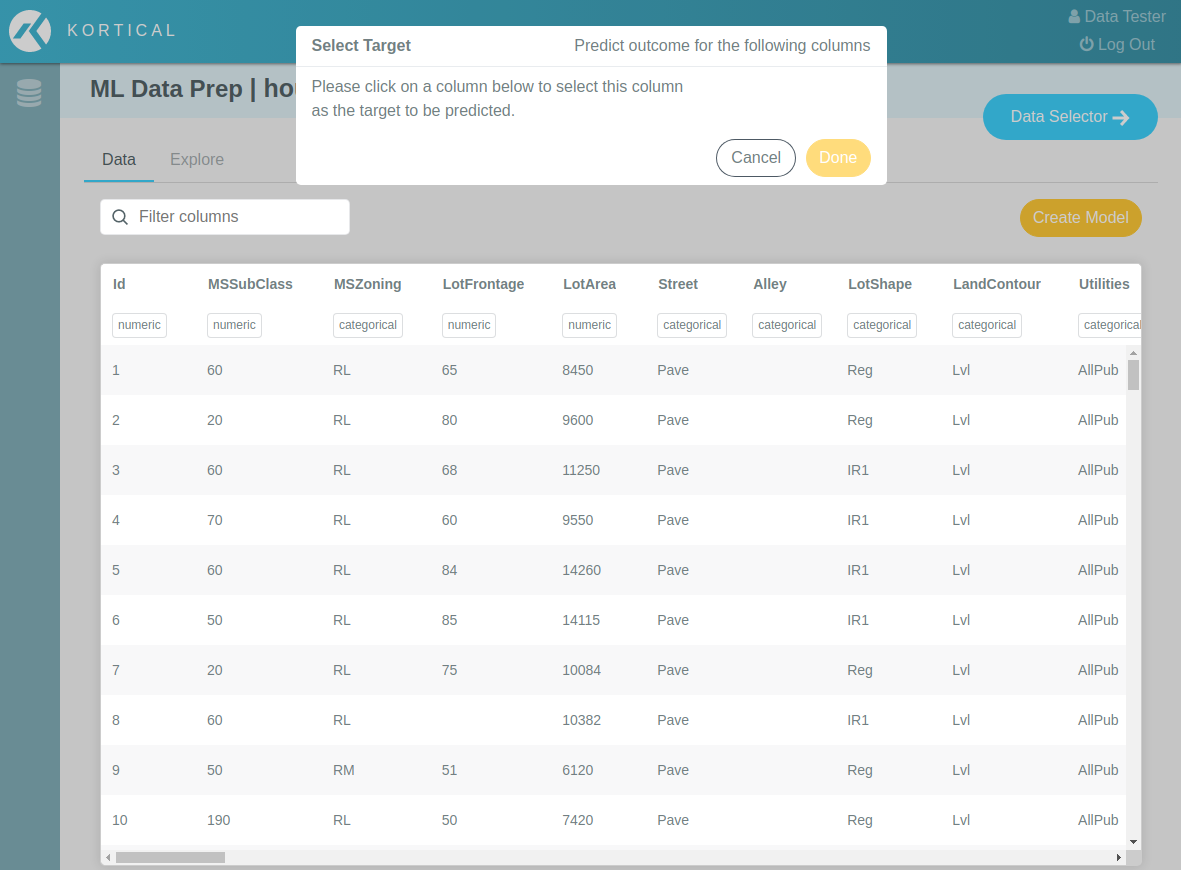
When the dataset analysis is complete, you will see the a sample of the data in tabular form and you'll be asked to select one or more target columns to be predicted.
# Select target columns
# Single target
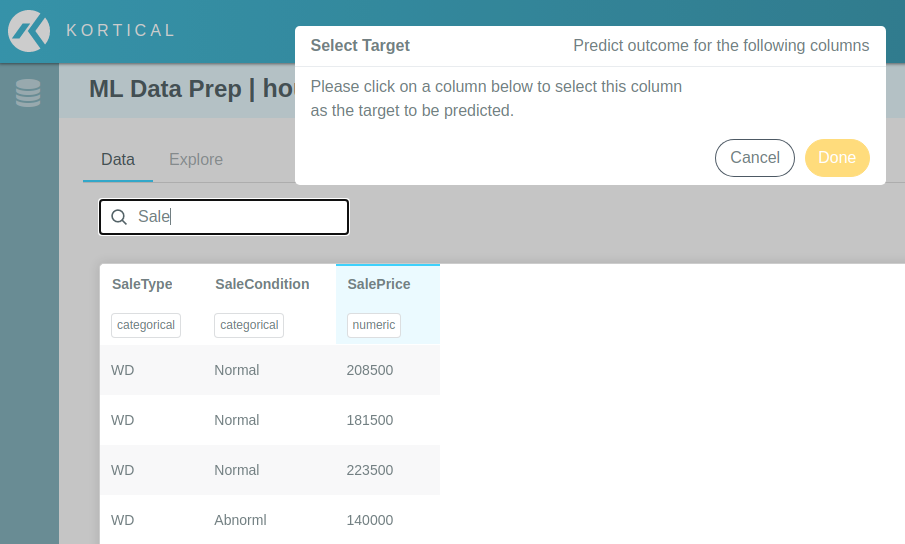
To find the column that you would like to use as the target, you can either scroll across until you locate it or you
can use the column filter box. In this case, we are looking for the SalePrice column:
Clicking on the target column opens a detailed view of the column metadata, which you can use to confirm that the
target looks as you would expect. Clicking Set as target will add the column to the target list (as shown in the
smaller modal at the top).
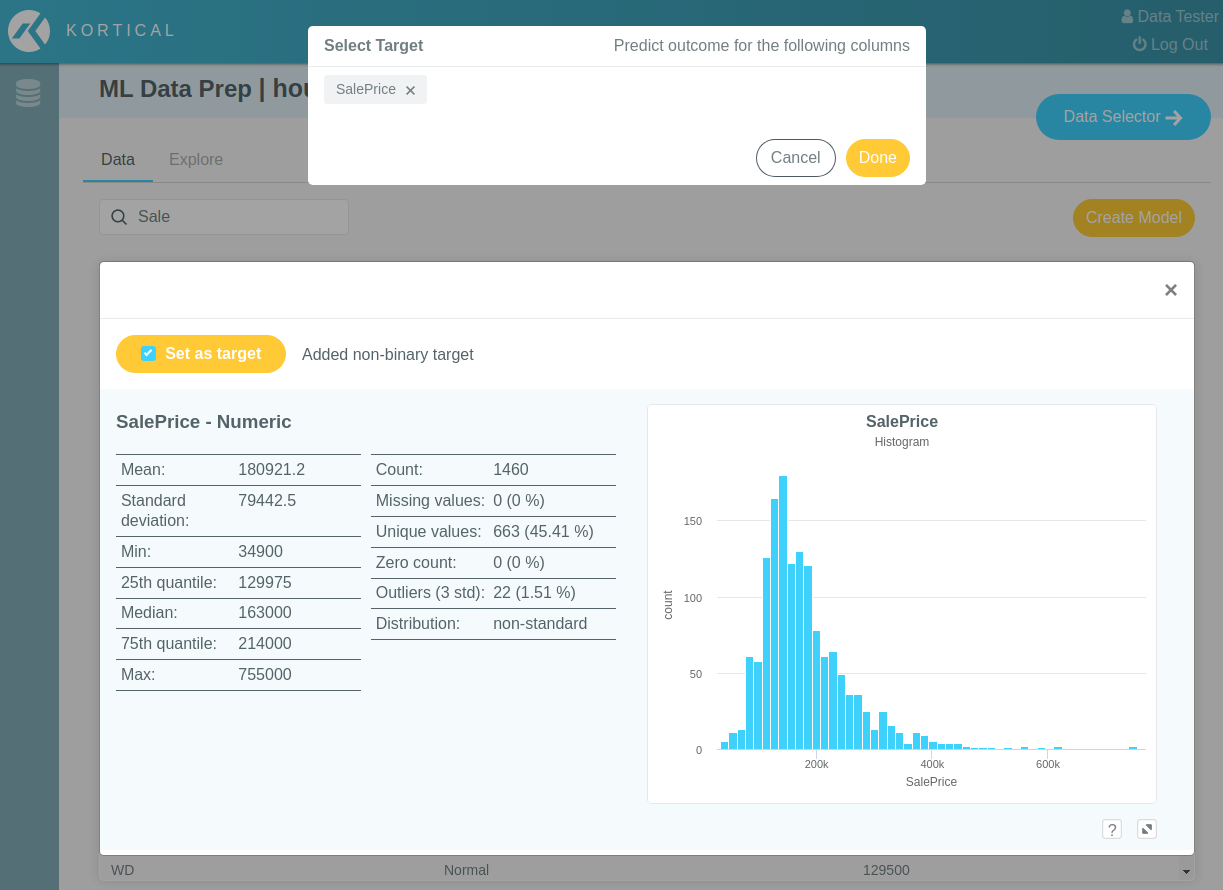
In this example, we are only selecting a single target. Therefore, you can now click Done on the target list modal.
This will automatically take you to the Explore tab and begin the
ML Data Prep process.
# Multiple targets
If you want to analyse a multi-label classification problem, you may select more than one target column. At present, only binary columns may be selected for multi-label use.
To achieve this, instead of clicking Done as in the single target case, close the detailed column view for your first
target and click on the next desired target column. For example, in the Titanic dataset you could add both Survived
and Sex as targets. After selecting Survived as the first target, opening the detailed view for the Sex column
would show:
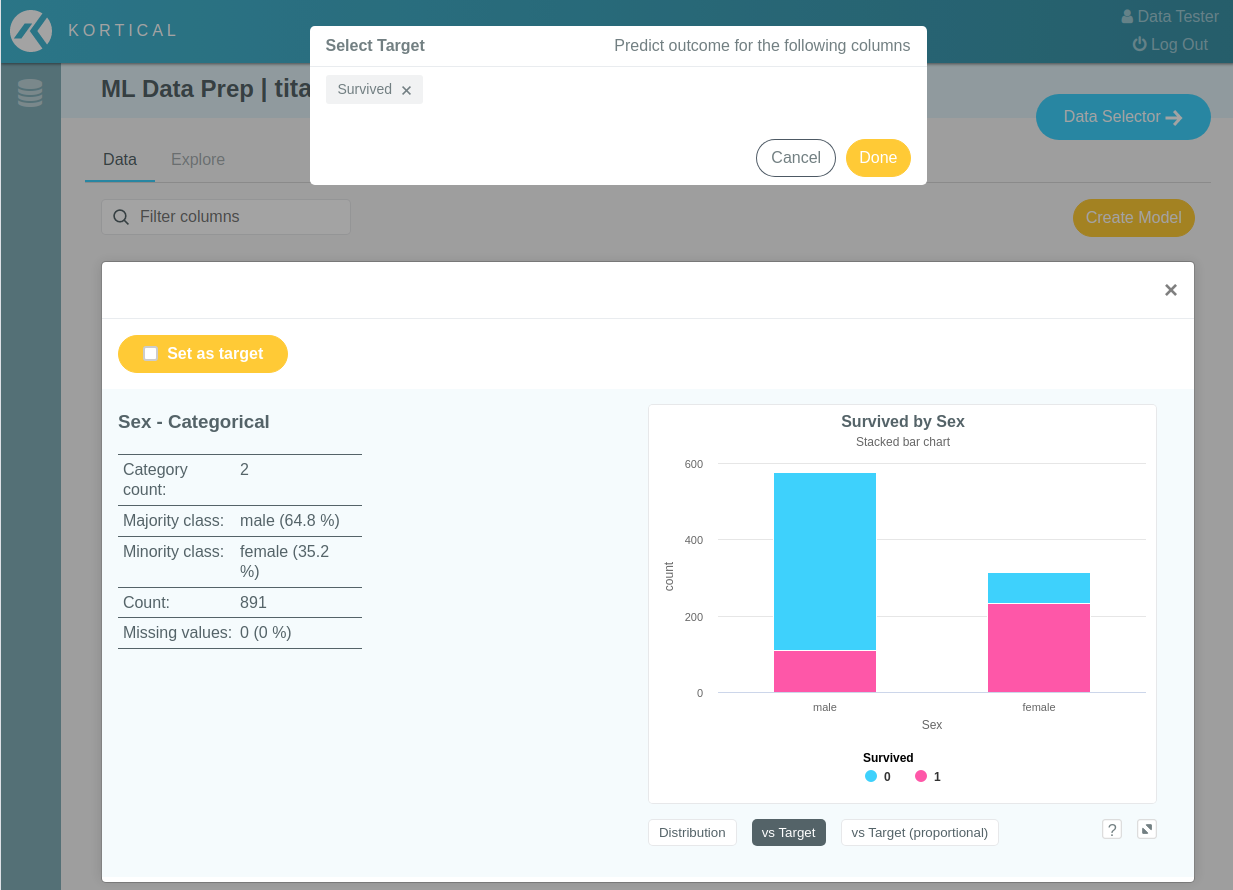
Because one target is already selected, you can now access additional charts to compare this column to the current
target (see vs Target and vs Target (proportional) links on the bottom right).
Click Set as target for the second column, and then continue the above process until all desired targets have
been chosen. When you're ready to explore the dataset with these targets, click Done on the target list modal.
# Analysing other columns
Aside from selecting target columns, you can also click on any column in the data view to see its detailed metadata and understand its basic relationship to the current target. Further information about each column is available once ML Data Prep process is run.
# Data and Explore tabs
Once your first dataset has been uploaded, Data and Explore tabs will appear on the data page. You can use these at any time to switch between the data view and the exploration report for the selected dataset. You must have a target selected to use the Explore tab, however.

# Data selector
After you have uploaded and explored your dataset, you will likely want to upload further datasets and switch
between them. To do this, click the Data Selector button in the top right corner of the page (regardless of whether
you're on the Data or Explore tabs). This will open the Data Selector:

From here, you can:
- Add more datasets using the
Add Datasetbutton - Search through existing datasets with the search box
- Download any dataset in the list using the download action on the right hand side of each row
- Select a different dataset to analyse by clicking on the relevant row
