# Explain - Model Explainability
Non-linear Machine Learning models such as Deep Neural Networks are notorious for being Black Box, that is to say,
opaque to interpretation. It is extremely important in today's world, however, to be able to understand why a machine learning model
has made a certain decision for a number of reasons:
- To sanity check we haven't accidentally included a leading variable (if we saw a column named
OutcomeTypeor something similar was the most important feature, we should double check this is a value we would have ahead of predict time). - As a guide as to where to spend time in feature engineering.
- To gather insight into the dataset and sense check this makes sense with respect to the business problem
- To assist with ethical obligations around removing bias by highlighting if the model is making decisions based on undesirable properties.
- To fulfill legal requirements such as GDPRs "Right to an explanation" (where an organisation has an obligation to explain the reasoning behind any decision which has an impact on an end user).
- To build trust in deployed applications in which humans are required to act upon the model output - an end user is far more likely to follow a model's recommendation if the machine learning is able to show its reasoning in a way a person can understand.
TIP
Some of these issues, such as understanding the data and identifying leaky features can be mitigated before training a model by exploring the training data with the platform's ML Data Prep feature.
# Kortical's Approach to Explainabilty
Since the Machine Learning Solution produced by the Kortical system may contain not just Deep Neural Networks, but
other equally hard to interpret techniques such as the latent semantic projection from methodologies like
word2vec or GLOVE, our explainability is derived by applying a heuristic to the end solution as a whole.
The methodology we use is, in essence, an evolution of techniques such as LIME (opens new window), whereby a set of simpler interpretable models can be used to explain a larger non-interpretable model. Unlike LIME, our methodology can deal with semantic text projections and is considerably faster and more efficient, which allows more accurate explanations and production level performance.
Note
This is a very different approach taken than with the feature importances in ML Data Prep. The Model Explainabilty described
here is very much model dependent, rather than attempting to be model agnostic. What this means in practical terms is that
the feature importances for the same dataset might be different if one has trained a Random Forest instead of a Deep Neural Network, since
they take very different approaches to solving the machine learning task and therefore might favour different features.
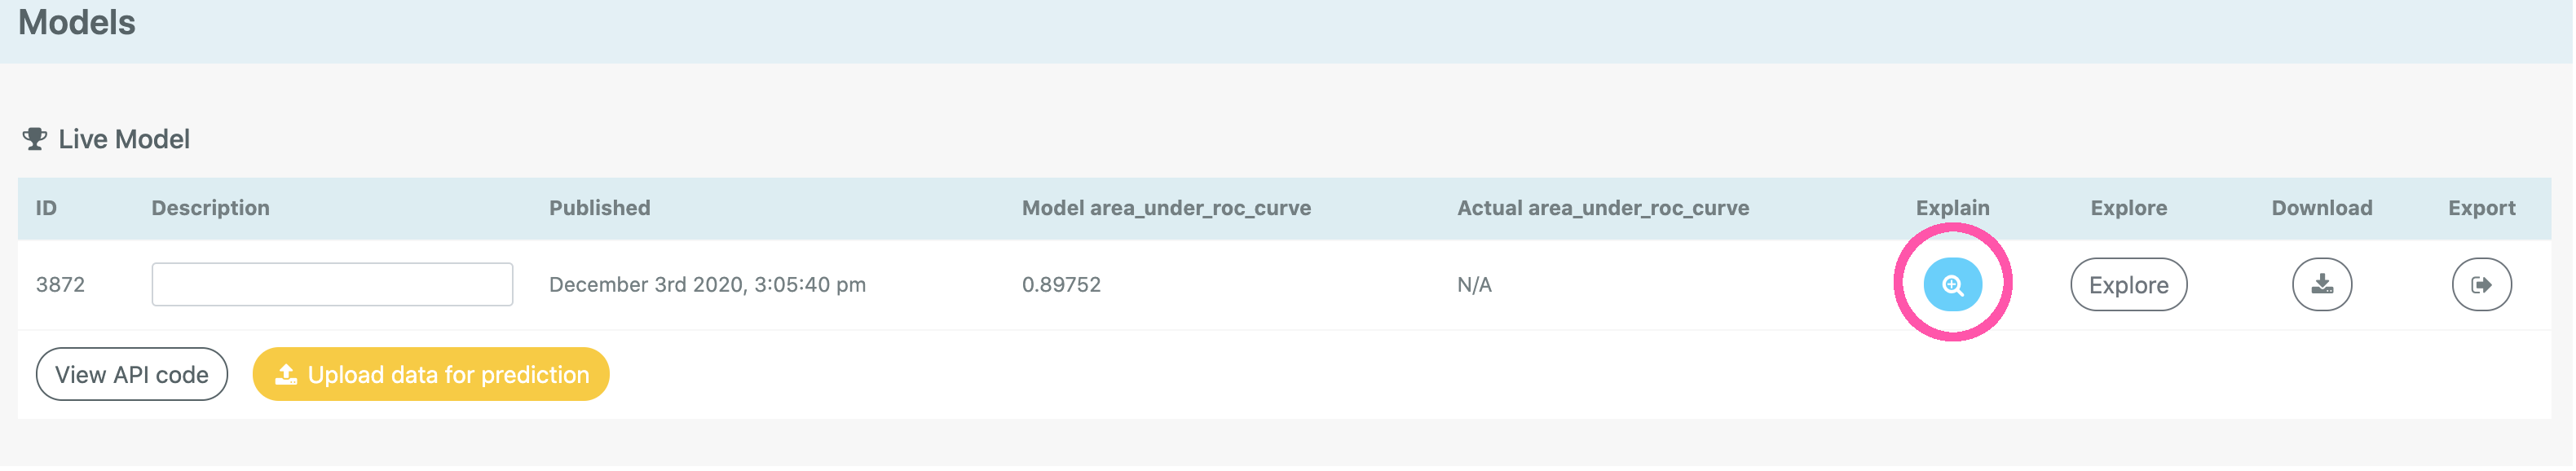
# How to Explain a Model
The model explainability feature can be found either from the magnifier glass icon against a published model in the Model Leaderboard:
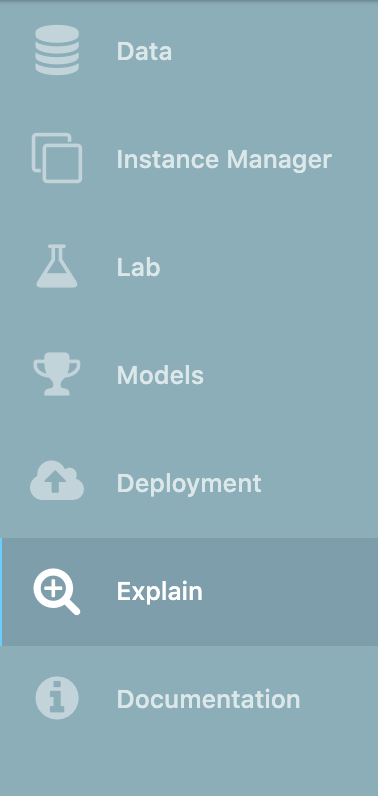
or from choosing Explain from the side menu:
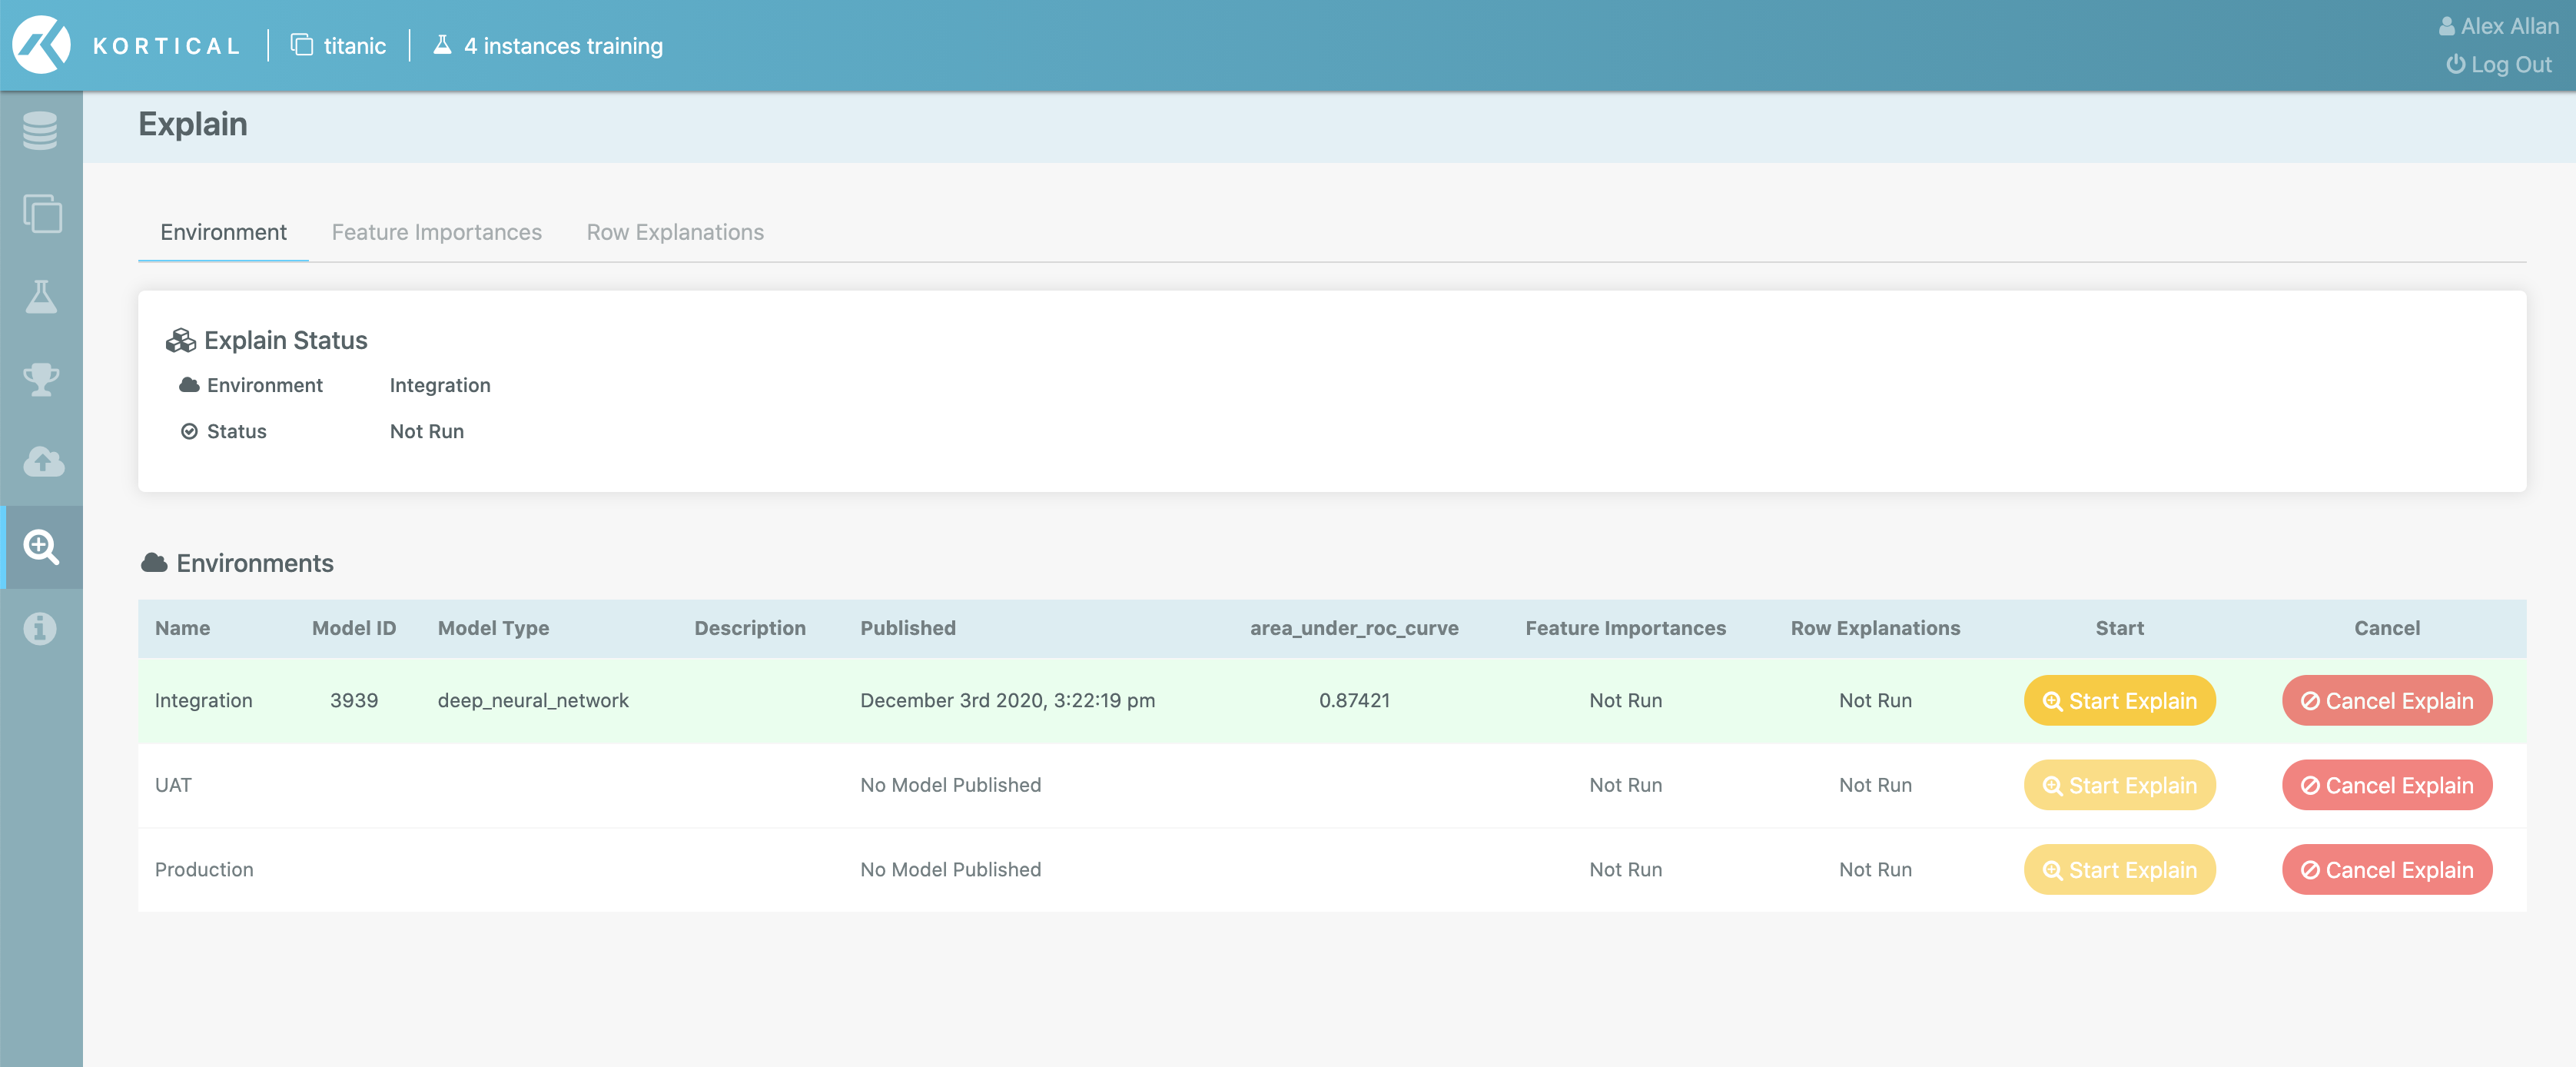
Once the explain page has been reached, we need to choose a model in this model to begin explaining.
Note
If you got to explain via the published model in the model leaderboard, it will skip this step and go straight to the Feature Importances tab (since the model leaderboard published model always runs in the Integration deployment).
To begin explaining a model, press Start Explain next to the relevant model.
This will begin the process of calculating both Feature Importances and Row Explanations
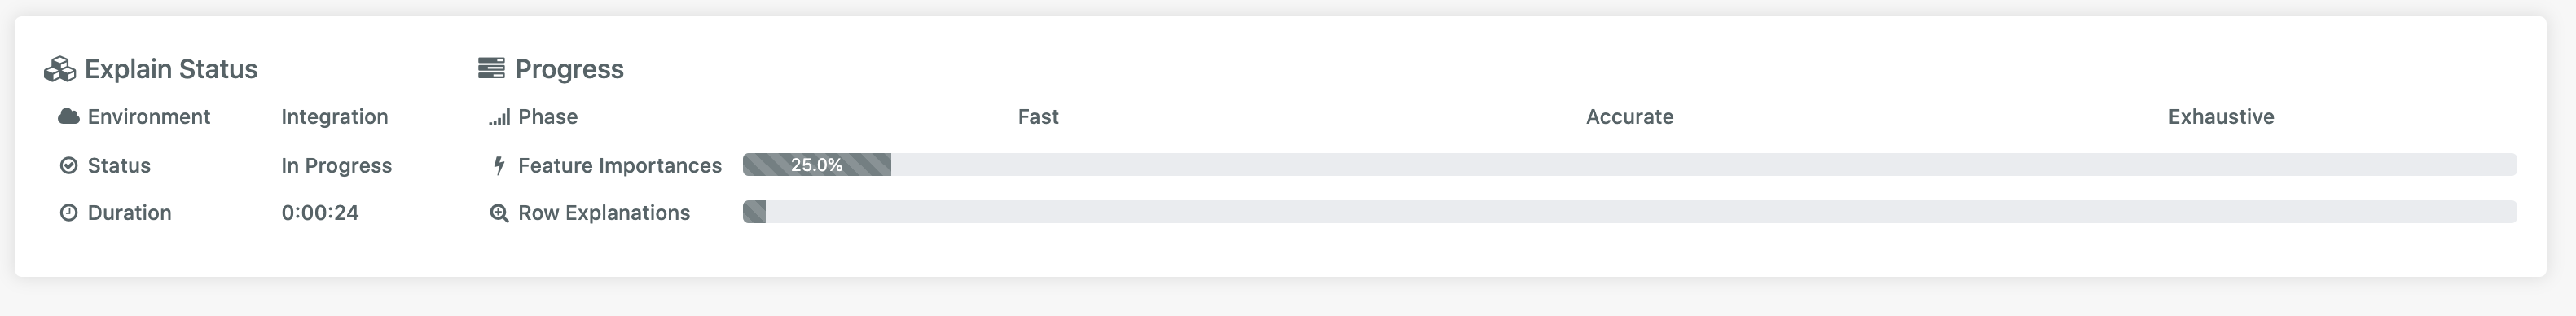
You will immediately see that there are two loading bars: Feature Importances gives a high level view of the global impact
that features have on the model, where the Row Explanations
are the local importances for a give observation.
There are three levels of resolution to Model Explainability:
- Fast - this executes quickly at the lowest fidelity to give some initial results. This stage is helpful for spotting leaking variables and sense checking the underlying data.
- Accurate - this gives a more refined update, and can be used to discover general insights for sense checking the business problem and steering the direction of feature engineering.
- Exhaustive - this is the highest resolution of explainability, and as such, should be used for any regulatory reporting requirements.
Note
When getting row explanations for a prediction via the API, the default resolution is exhaustive.
You can select between Environment, Feature Importances and Row Explanations through the tab at the top of the page
# Feature Importances
This gives global visibility on how which features are important to the model. We have two levels of resolution:
- High-level Feature Importances - which gives importances across all features and all observations
- Low-level Feature Importances - which breaks down which constituent values of features are important.
# High-level Feature Importances
This gives an overall view of how important each feature is at predicting the target (across all classes if problem type is classification):
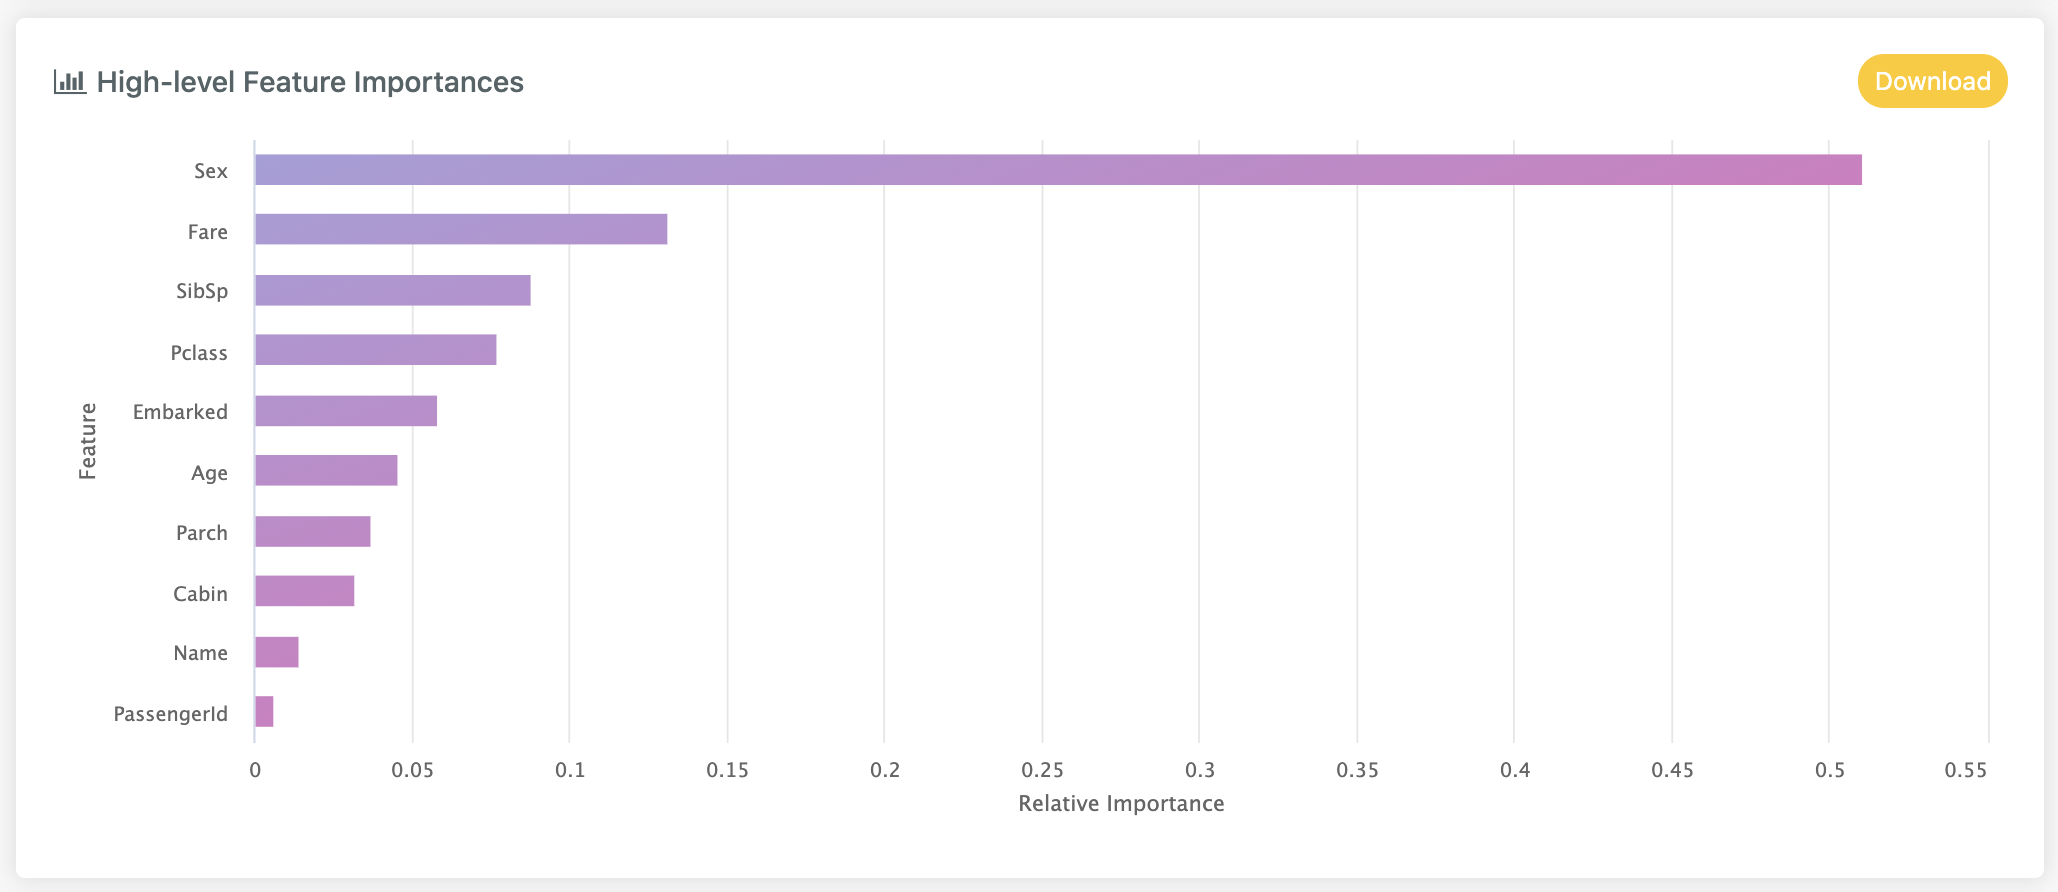
The x values describe a relative importance weighting which will sum to 1. We can download these as a CSV file by clicking
the Download button.
# Low-level Feature Importances
Low-level feature importances gives a more detailed breakdown of the specific values within each feature that are most important to the model.
For categorical or text data types, the feature is broken down by category or word. With date features, the importance
of the given time period e.g. day_of_week will be displayed. For numeric features, any important value ranges or thresholds
are highlighted.
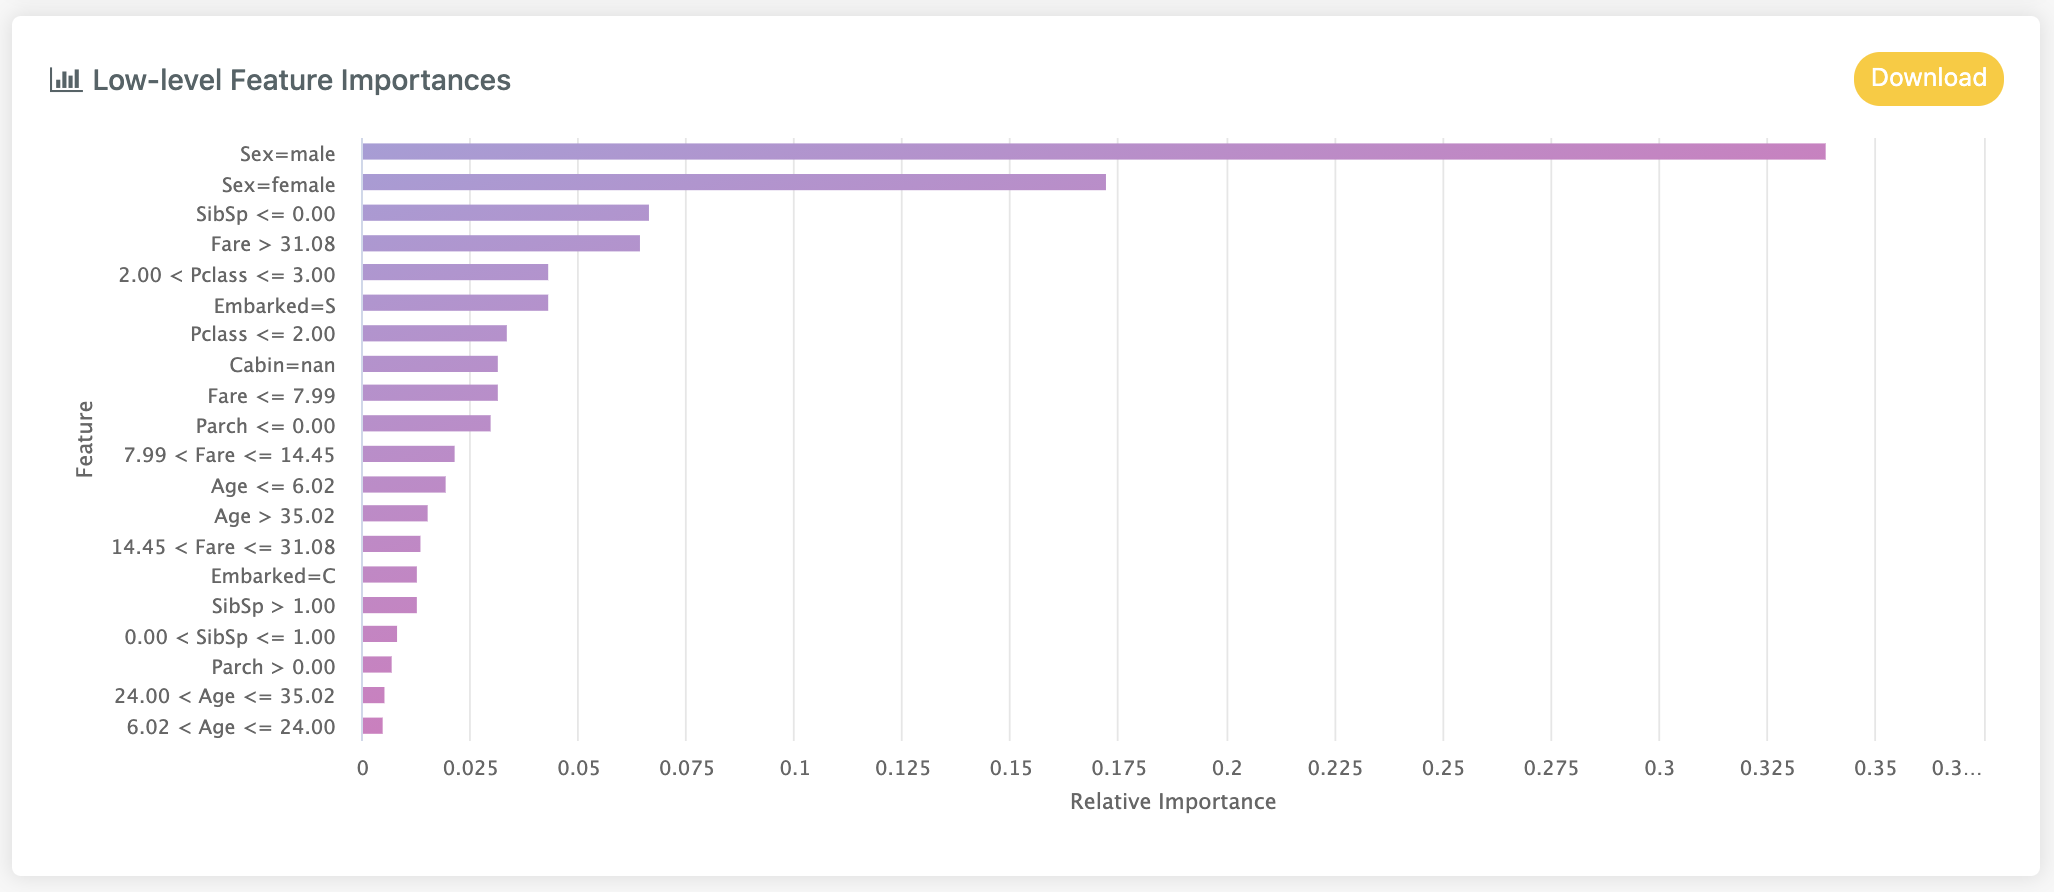
In the above for example, we can see that paying more than £31 for a ticket had a particular importance.
# Row Explanations
The Row Explanation view gives users a per-observation breakdown of the factors the model deems important for specific row in the dataset.
A number of rows are randomly sampled from the test set, with the model making predictions and explanations for each.
There are two elements to this view:
- The
Explain Resultsview shows the models predicted outcome and the most important positive and negative drivers. - The
Explained Rowsview which is a table of observations we can see the explanations for.
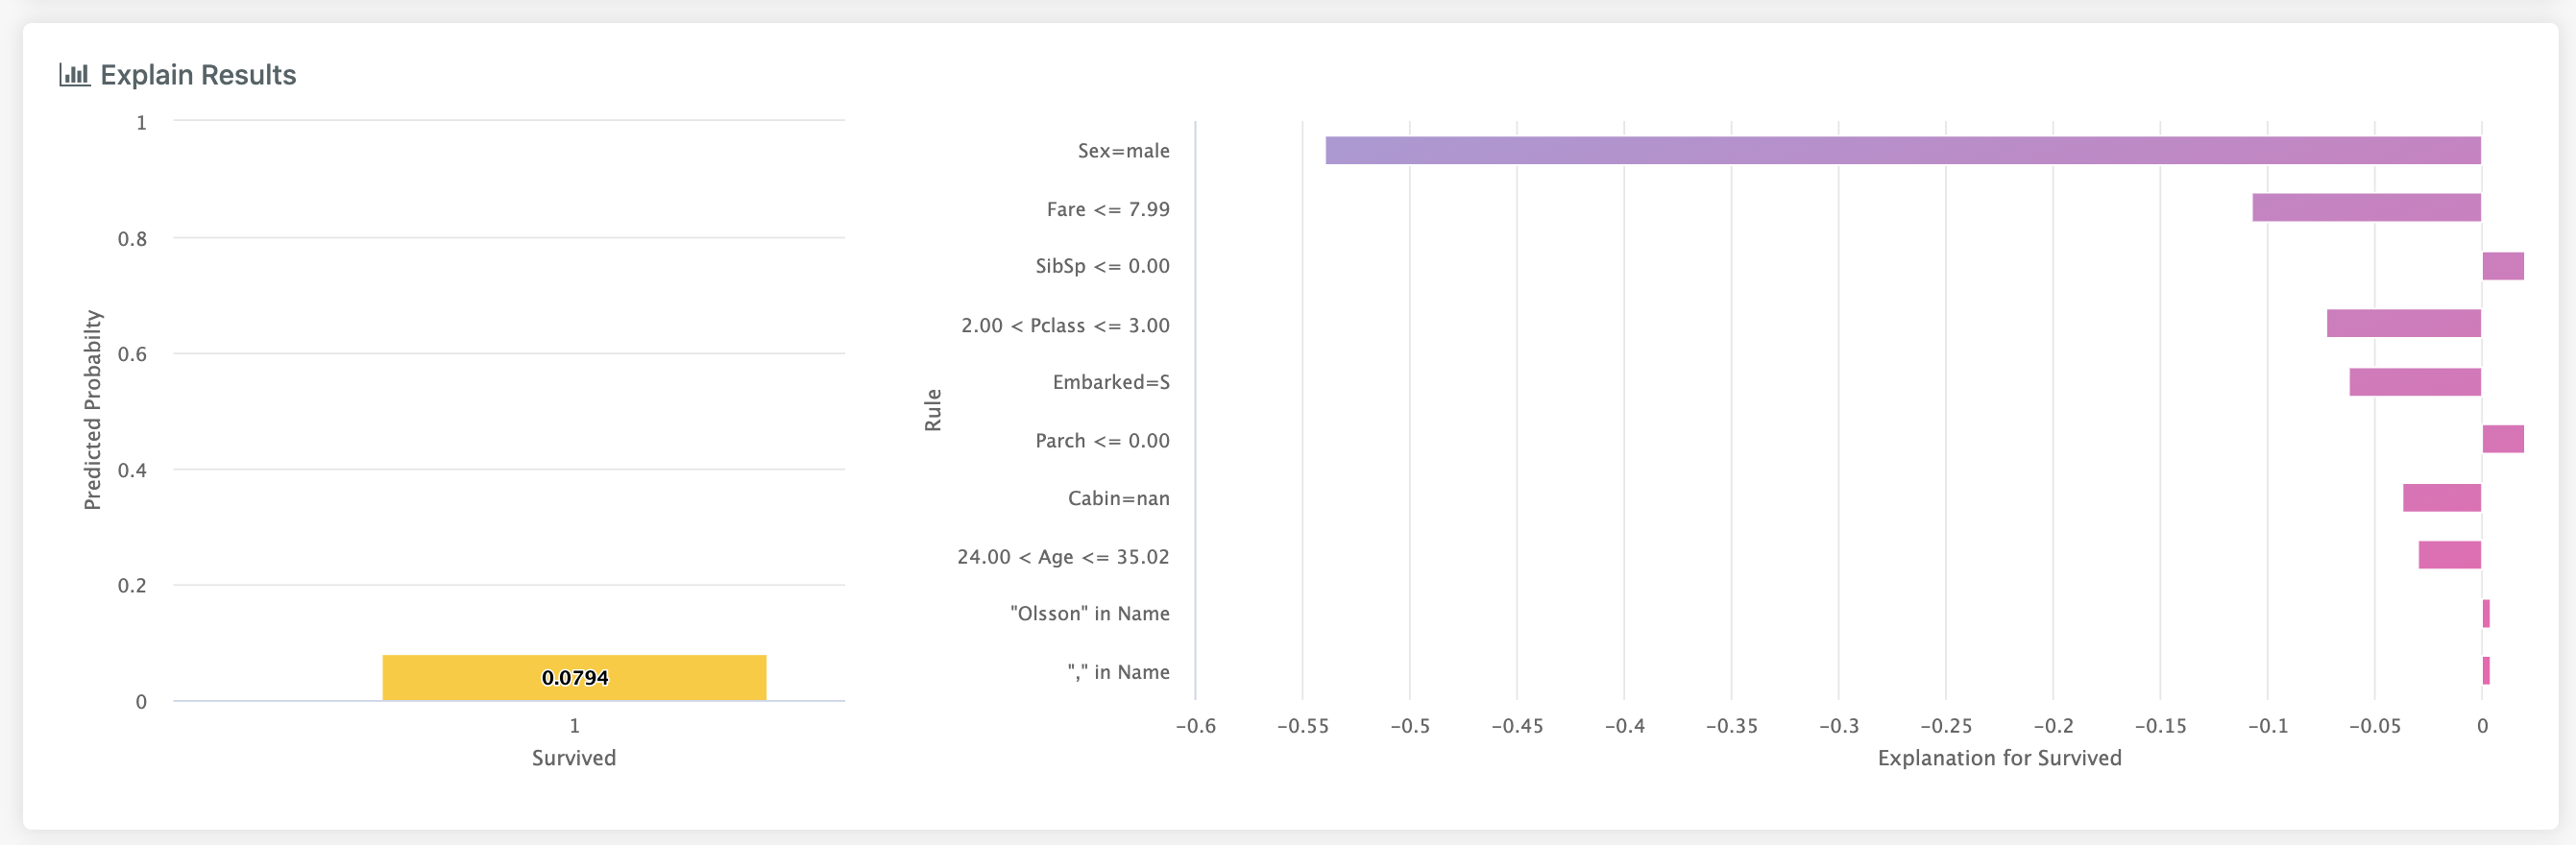
# Explain Results
The simplest version of this view is seen when we have a binary classification or regression problem. In this model we have a single column
in the left hand part of the view. The height of this column represents the probability the model gives to this observation in the binary regression case,
or the magnitude of the output if regression.
In the more complex case, either multiclass classification or multi-label classification, we have multiple columns in the chart on the left.
Note
In the multi-label case, these probabilities wont necessarily sum to 1.
Each column represents the probability the model gives to this observation belonging to a specific class.
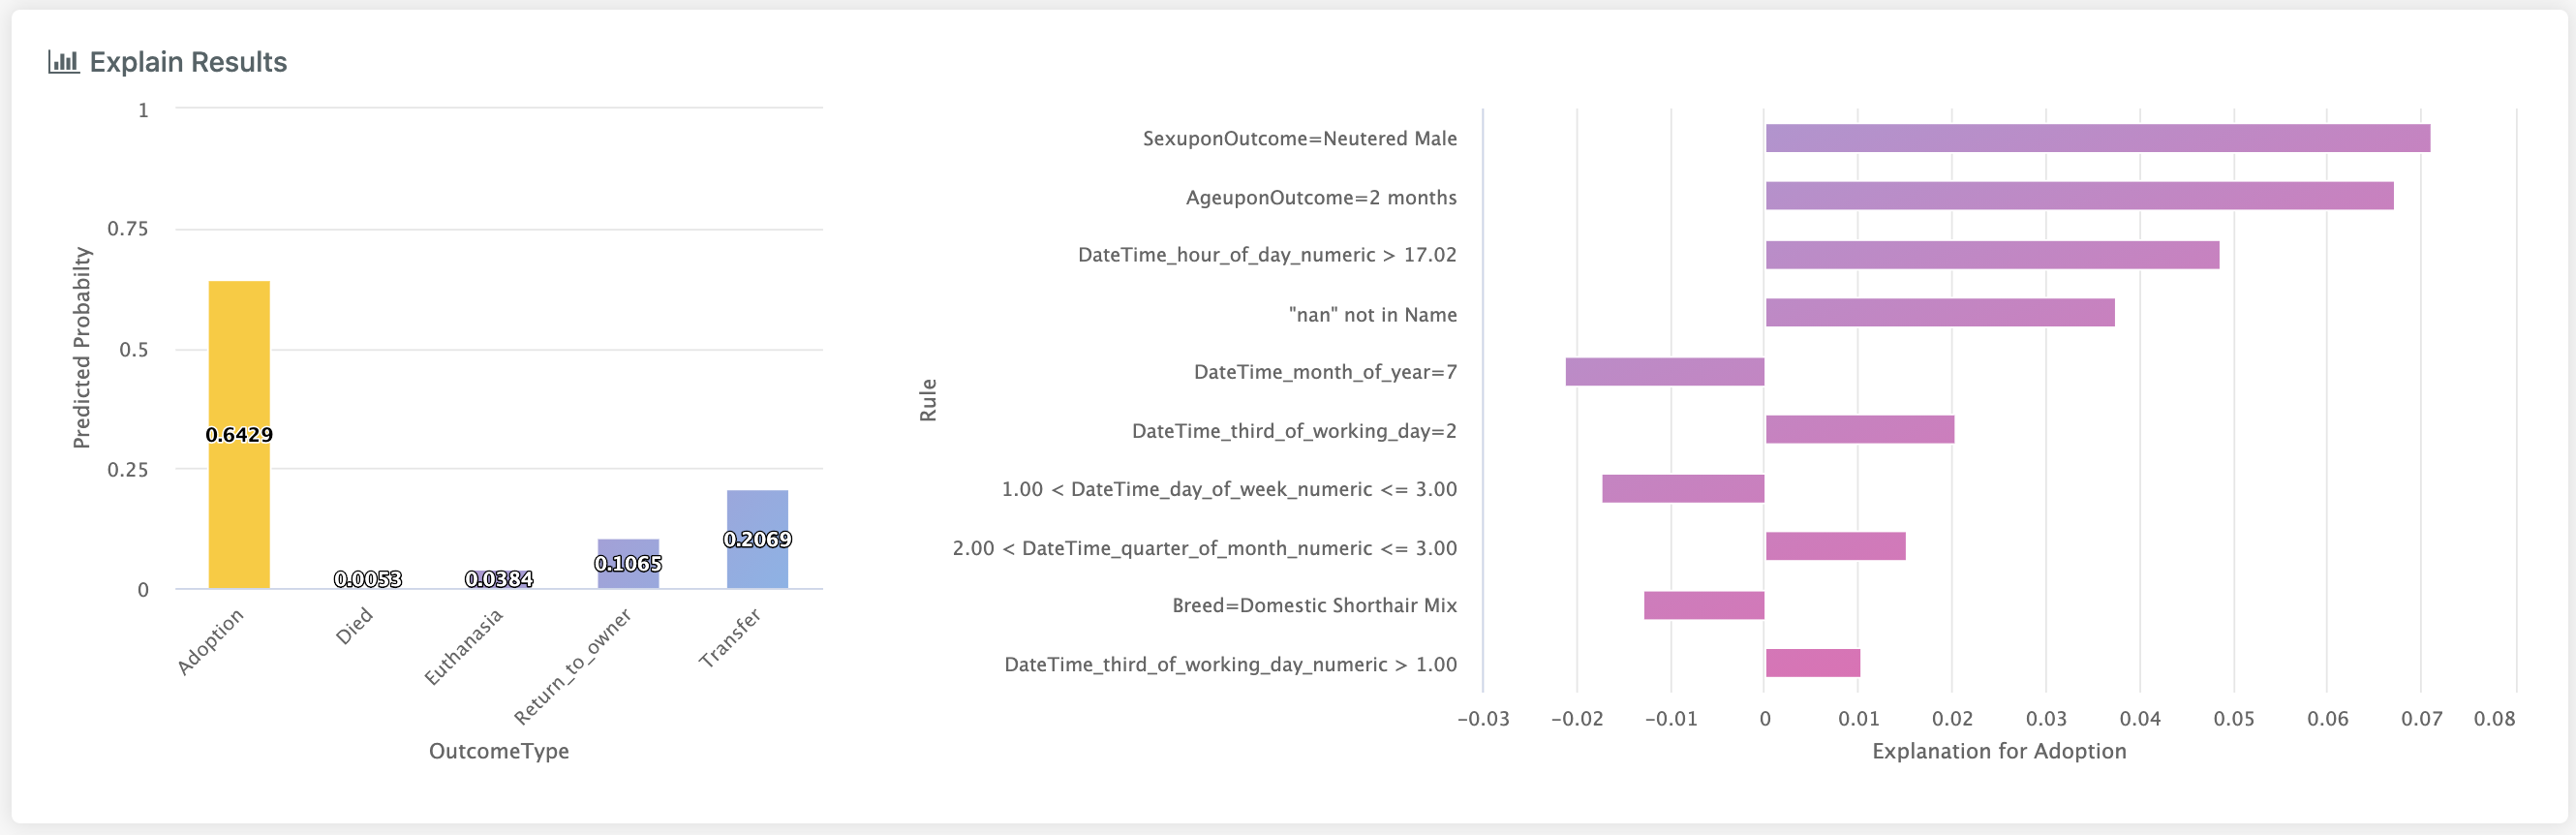
Clicking on a different column will change the class we are explaining and will update the bar chart on the right:
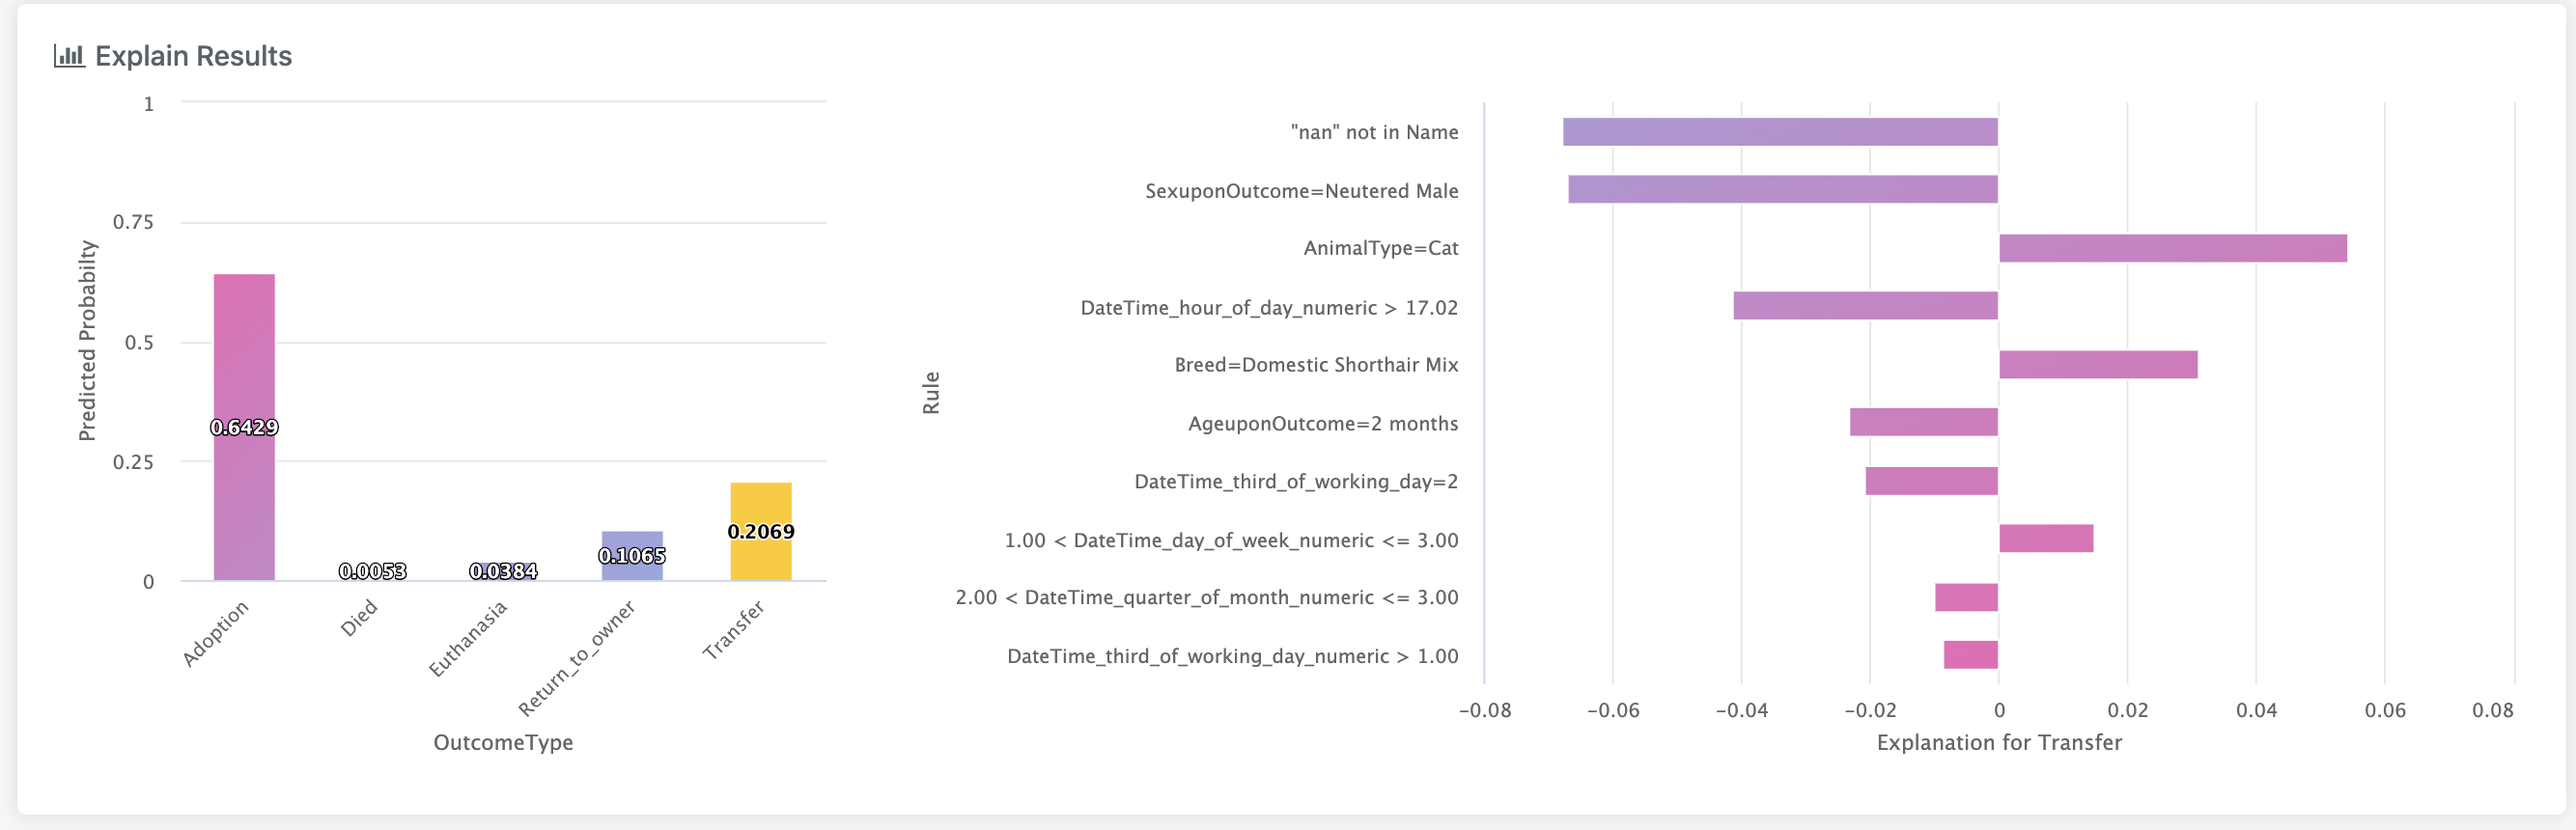
This is extremely useful when we have a model which consistently mistakes one class for another, since this view allows us to see which factors are driving the confusion.
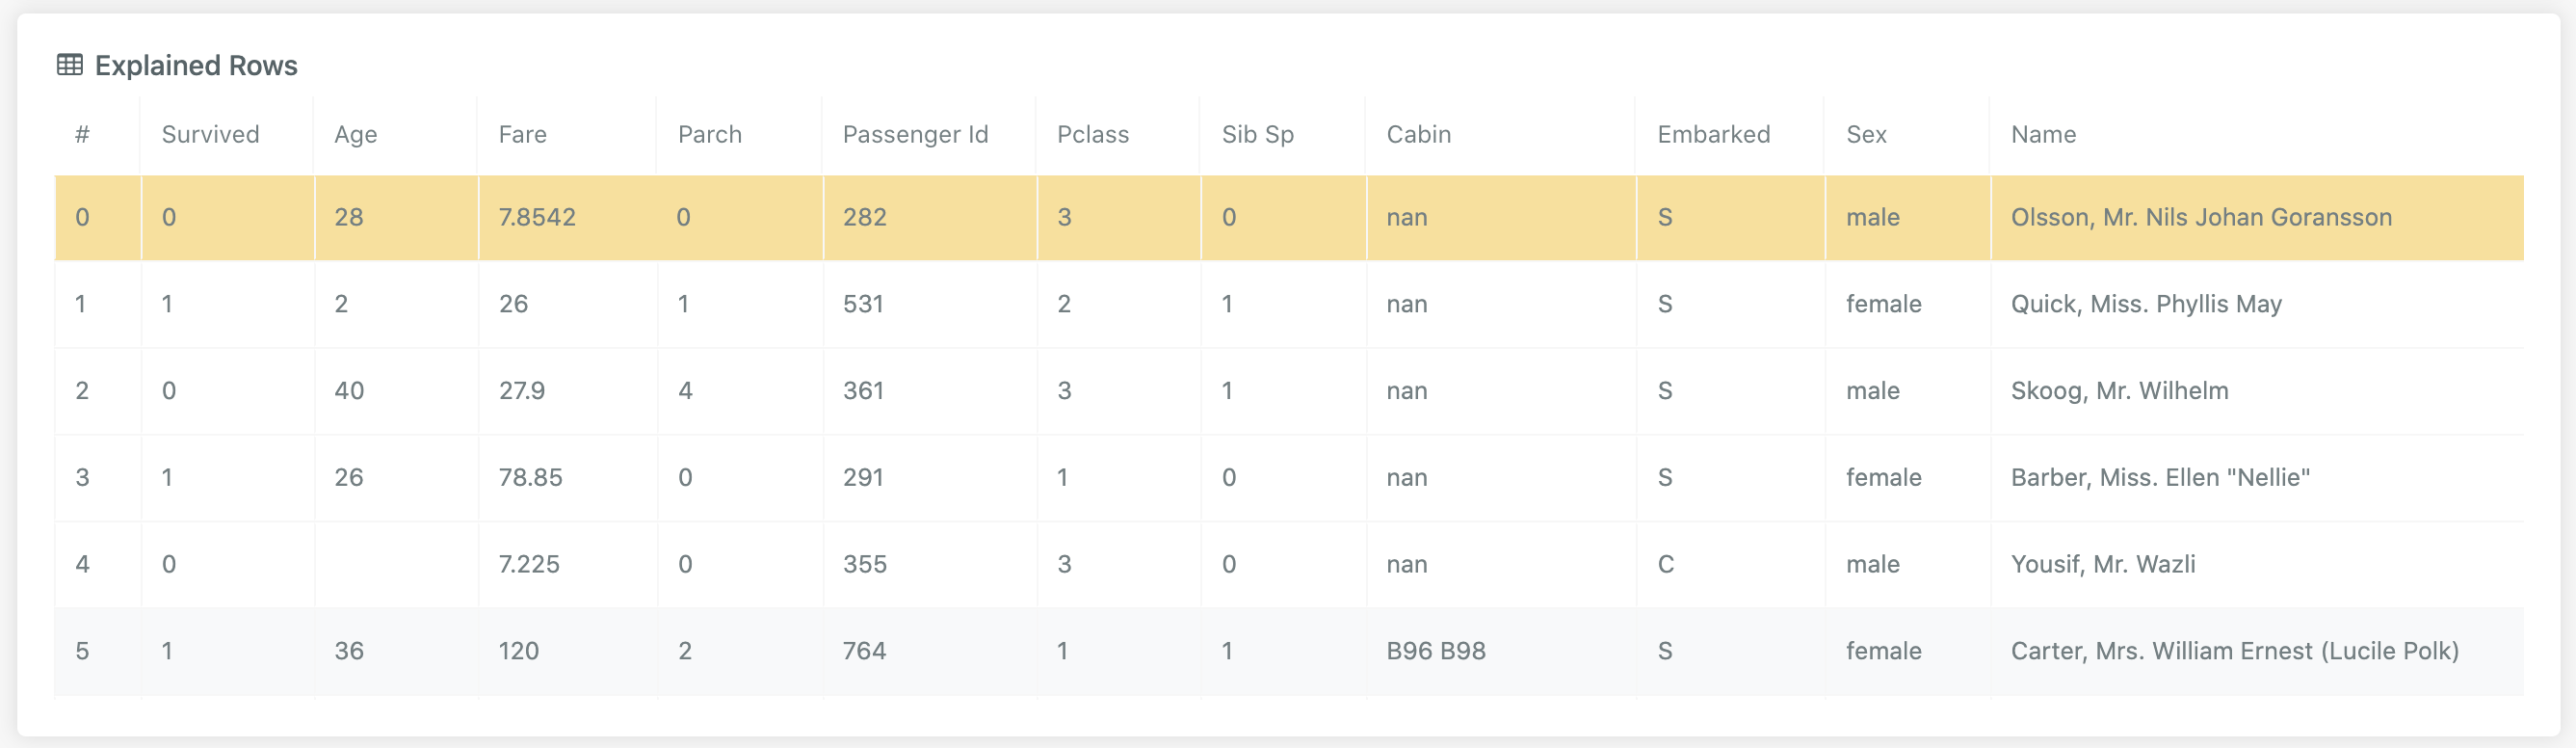
# Explained Rows
This is a list of observations sampled from the test set which have had their explanations pre-computed. Clicking on a row
in this table updates the Explain Results view to show the model prediction and explanation for this observation.
If a row is clicked but the Explain Results don't subsequently update, this may be because the initial explain hasn't finished
yet:
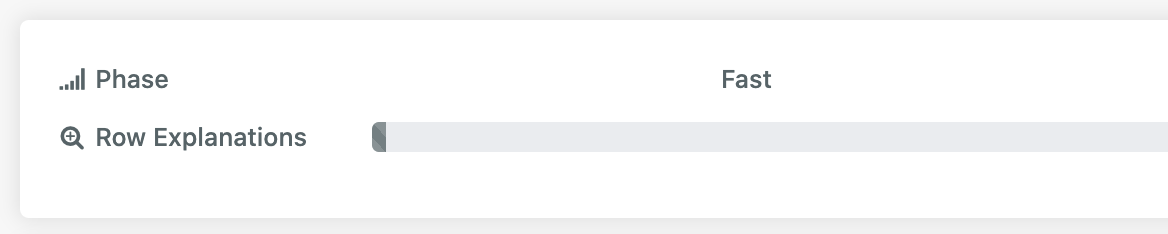
Simply wait a little while for the first phase to complete, at which point all rows should be clickable.