# Lab
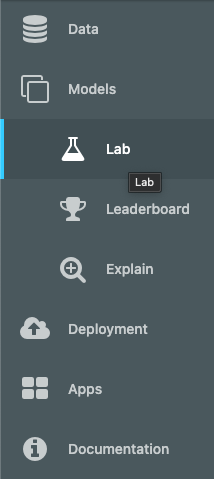
The Kortical Lab page is where you perform all tasks relating to creating models with Kortical's AutoML. You can access it from the side menu.
# Start creating models
There are two ways to start the model creation process:
Use the Create Model button on the ML Data Prep page after you've completed your analysis. This will automatically create an model, go to the Lab page and complete all the steps below so that training starts with the default configuration for that dataset. This is a good choice when you're familiarising yourself with the Kortical platform.
Go to the Lab page and follow the steps below. This approach allows you more control over the way training is run, and is powerful as you build your familiarity with the training process.
You can always start with the fully automated approach (option 1) and then dive into the details with option 2 on subsequent runs.
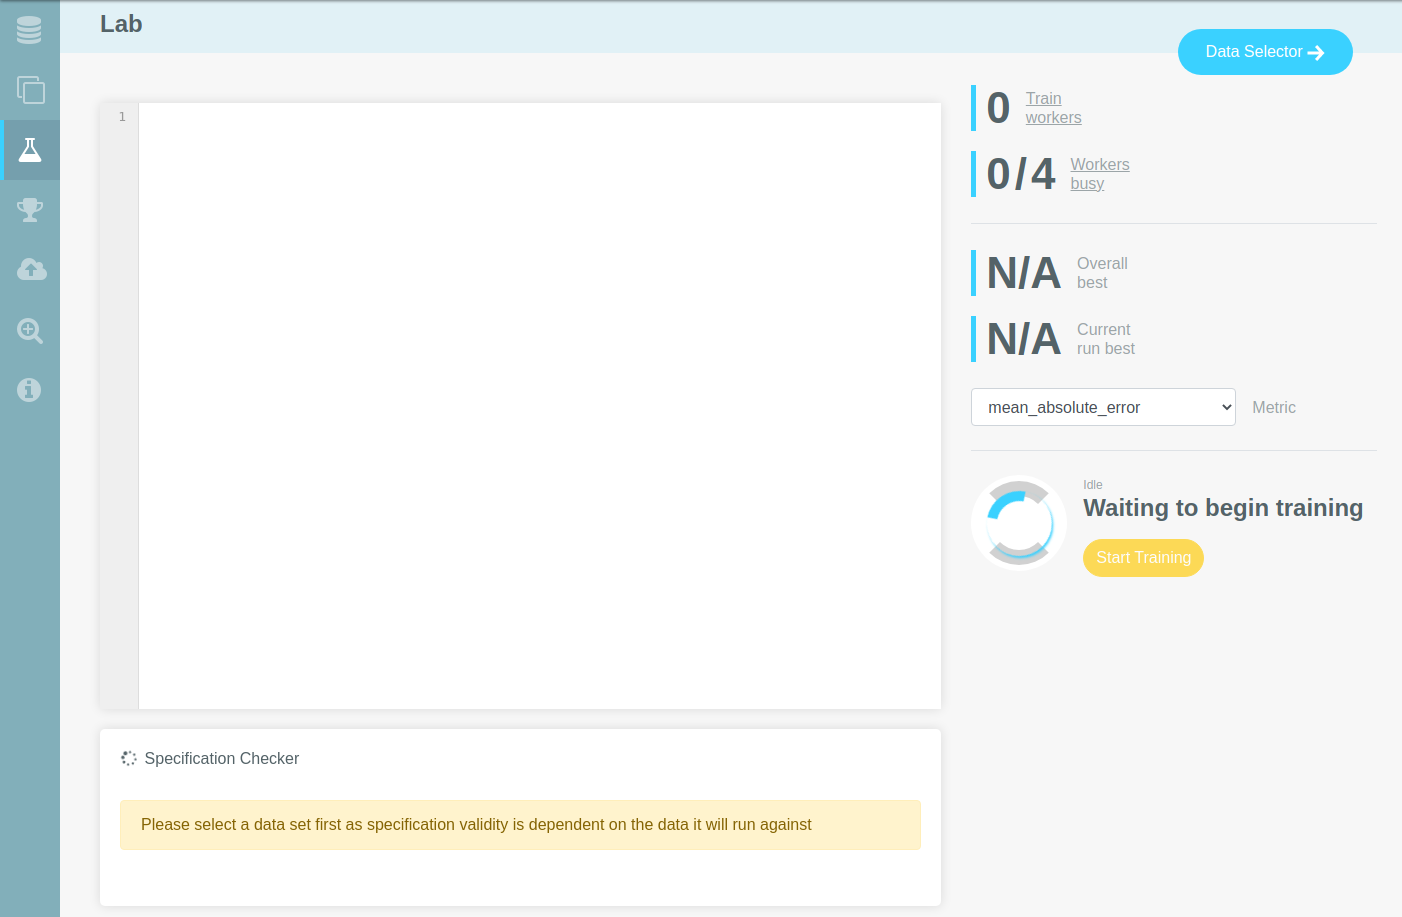
# Open data selector
The first step is to select a dataset with the Data Selector button on the top right.
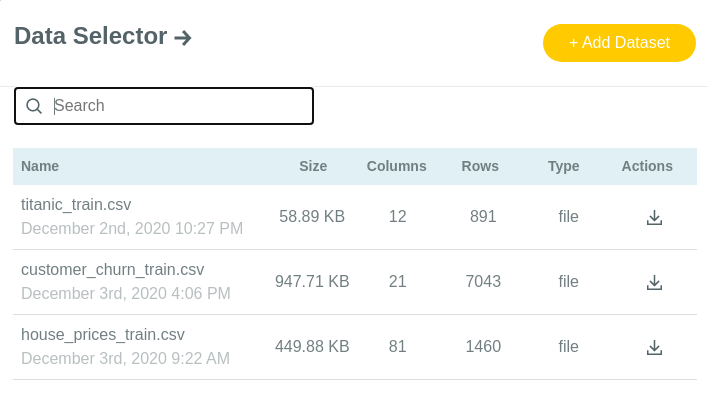
# Select dataset
Use the Data Selector to choose the dataset you want to use for model training.
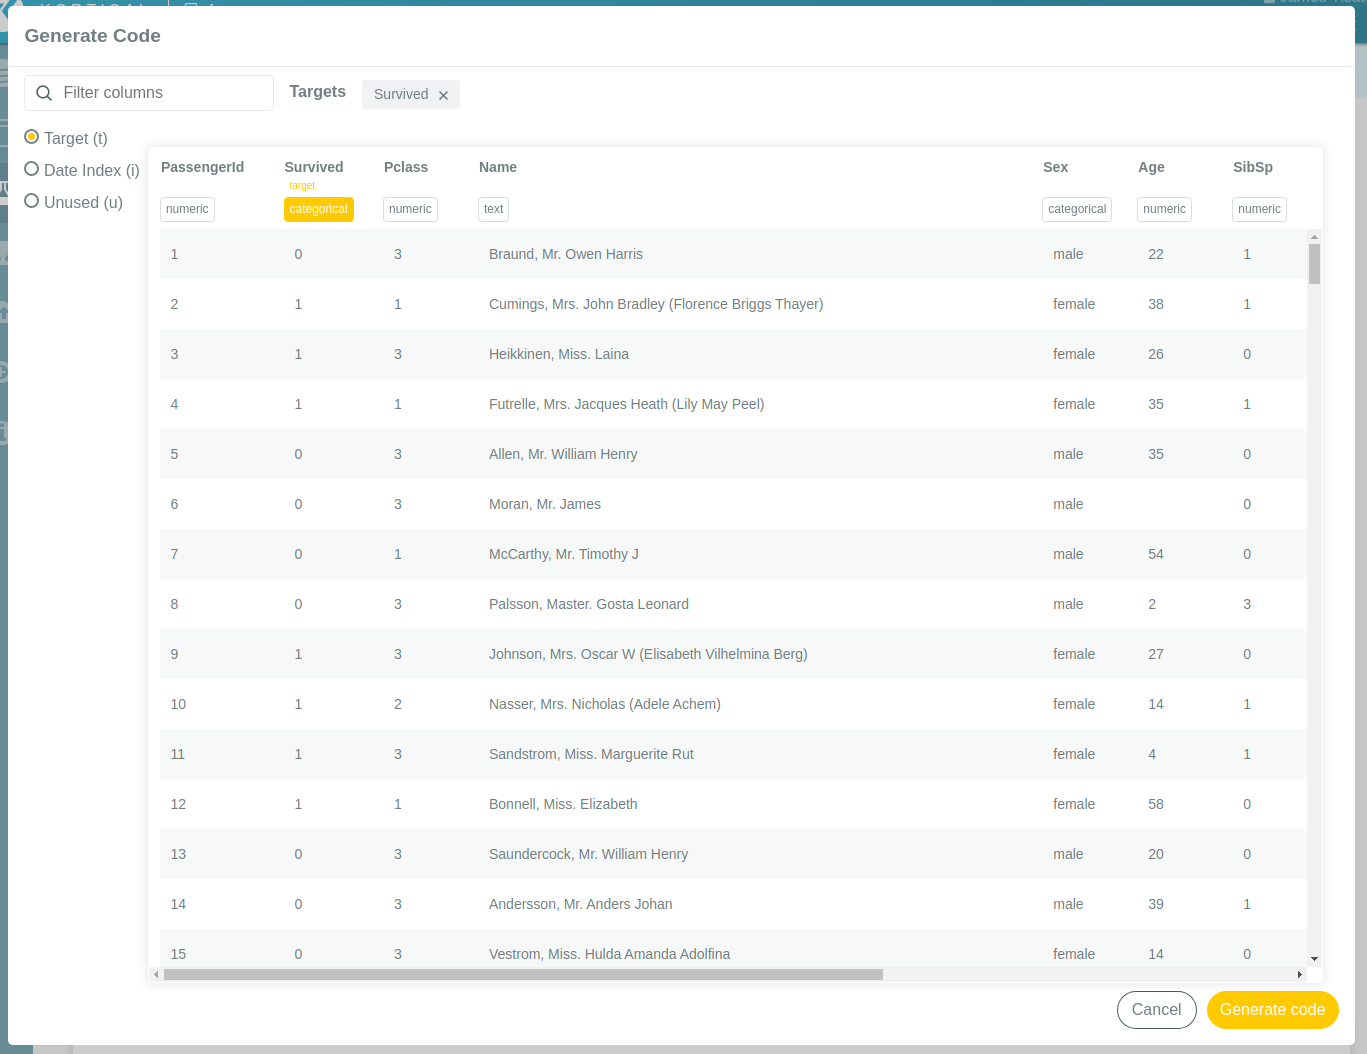
# Generate code
Clicking on a dataset will bring up the Generate Code screen. Here you can view a sample of the data and make some column changes (if desired). Clicking Generate Code in the bottom right will generate the default training code for the dataset.
# Edit code
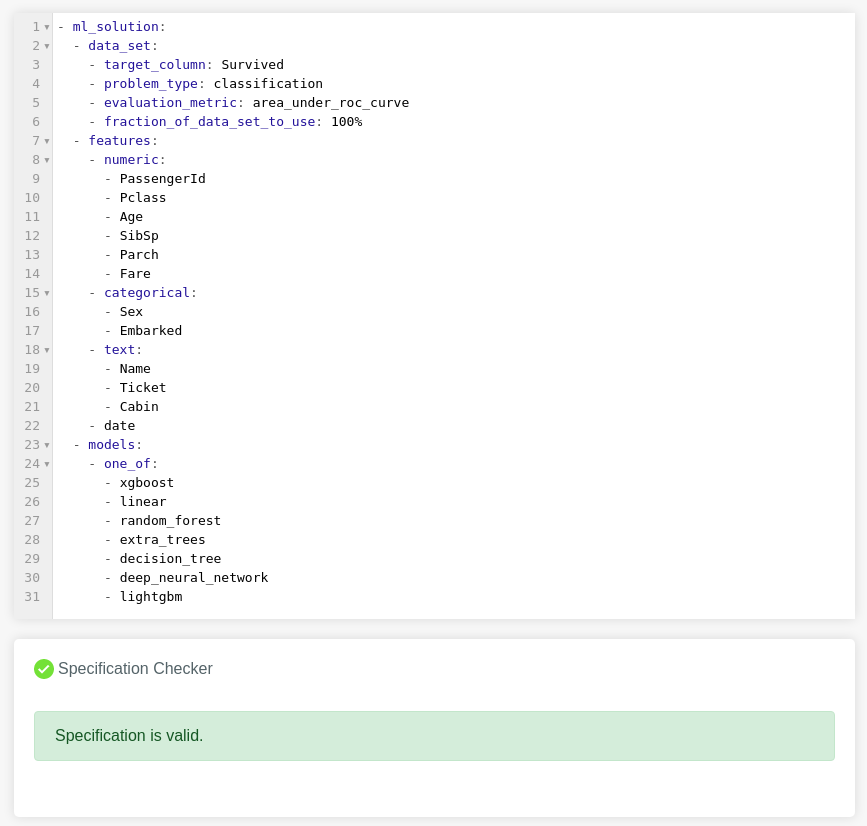
The generated code, expressed using the Kortical language, contains Kortical's best estimate of the configuration to use for training with the selected dataset. It is derived from metadata extracted from the dataset's columns. In the default code, we omit the configurations for data preprocessing, feature creation and model parameter selection - these are automatically chosen by Kortical when training begins.
However, if you want you can freely edit the default code to customise how models are trained. For example, you may choose to:
- Remove or change the type of a column
- Add specific preprocessing or feature creation configuration for one or more columns
- Specify particular model types or parameter ranges to use
The specification checker will confirm that any edits you make are valid.
# Start training
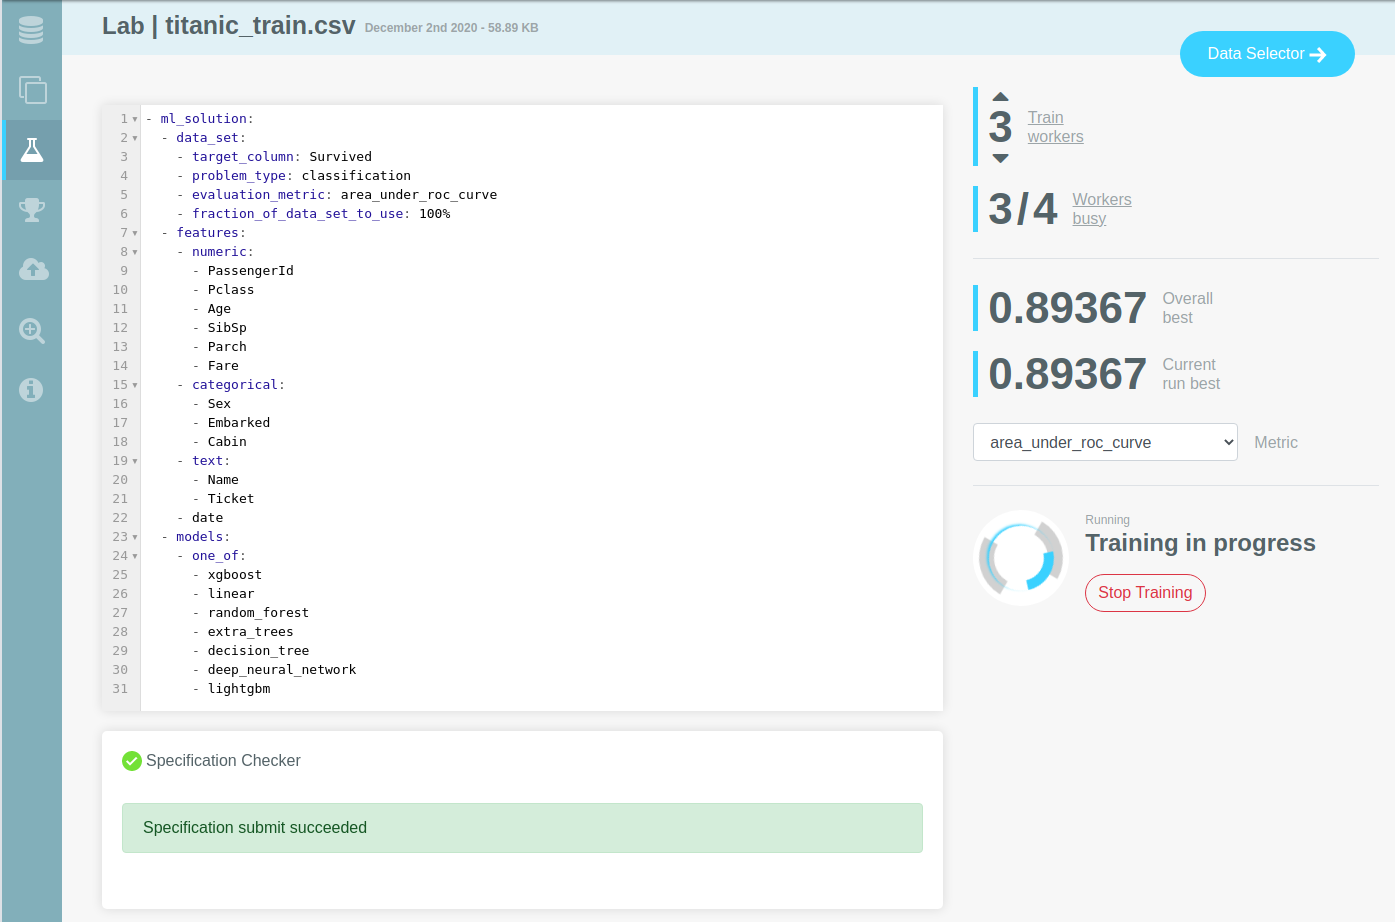
When you're ready and your code has passed validation, you can click the Start Training button on the right. The code you've submitted now drives the AutoML process. Train workers will be allocated to the new training run and Kortical will begin creating models. The optimisation process will guide training towards the most effective parameter selections for the dataset.
# Monitor training
You can track the progression of model scores throughout the training optimisation process using the lab charts.
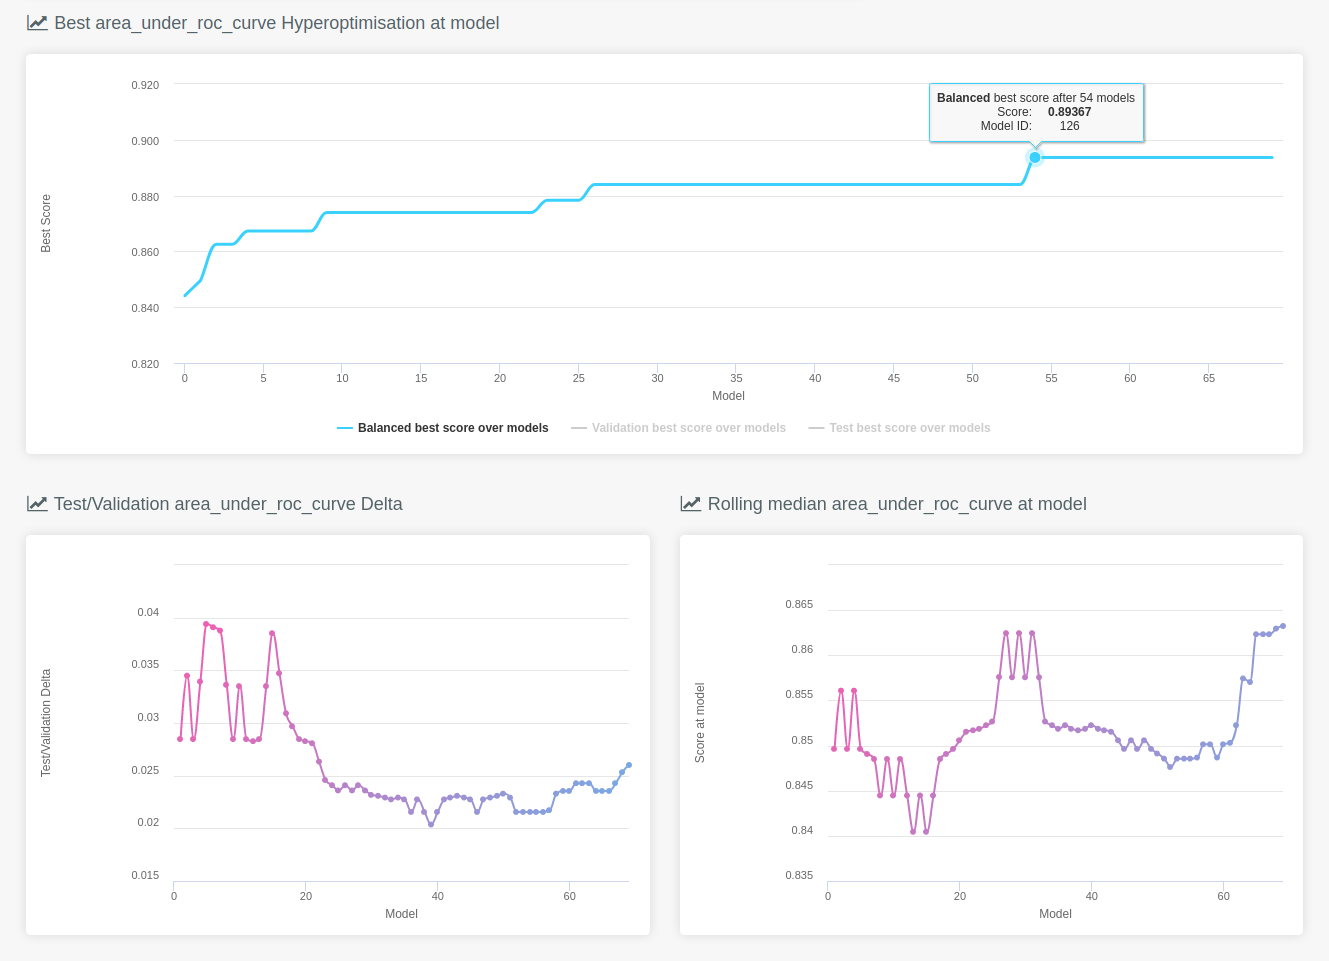
These charts work together to track the progress of a model train in different ways.
# Best metric Hyperoptimisation at Model
The chart at the top shows the models with the best balanced score (given the chosen evaluation metric) found so far:
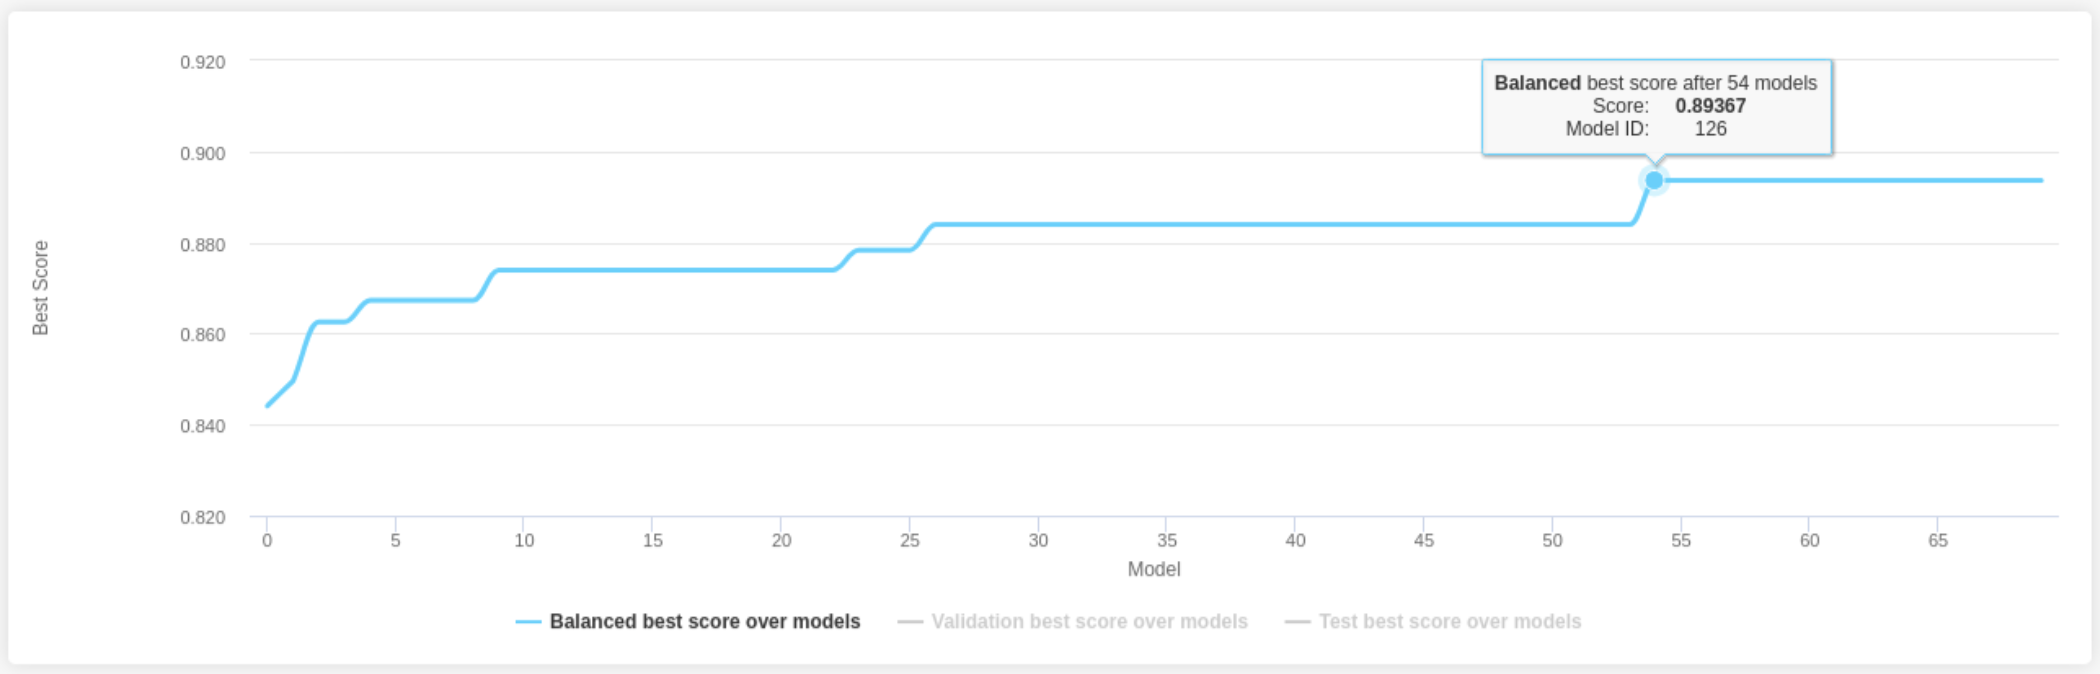
Points on this chart can be clicked, taking the user to an opened explore page for that model.
# Test/Validation metric Delta
The chart on the bottom left shows the rolling delta (difference) between train and test sets
scores, given the evaluation metric:
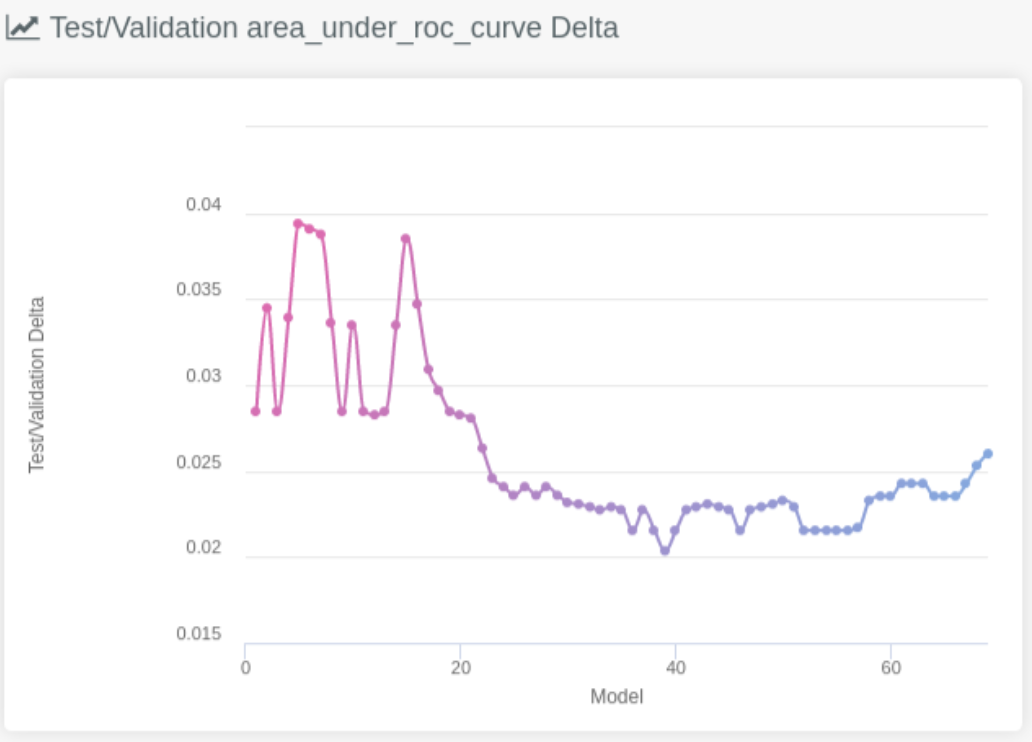
This can sometimes be helpful for very long training runs to determine if we might be starting to overfit on the problem
and that it might be time to stop training, as scores probably wont improve from this point. This behaviour would be characterised
by a growing increase in the delta.
Note
Overfitting is something that can happen with any AutoML approach but we usually only see this in situations where the test set is very small and the training run exceptionally long.
# Rolling median metric at Model
This graph gives a view of the median score across all models being considered by the platform. Its also useful for understanding if we have reached a point of convergence and can stop training. We should initially expect to see ups and downs as the AutoML explores the potential solution space, settling into, and escaping from, local minima/maxima such as we see here:
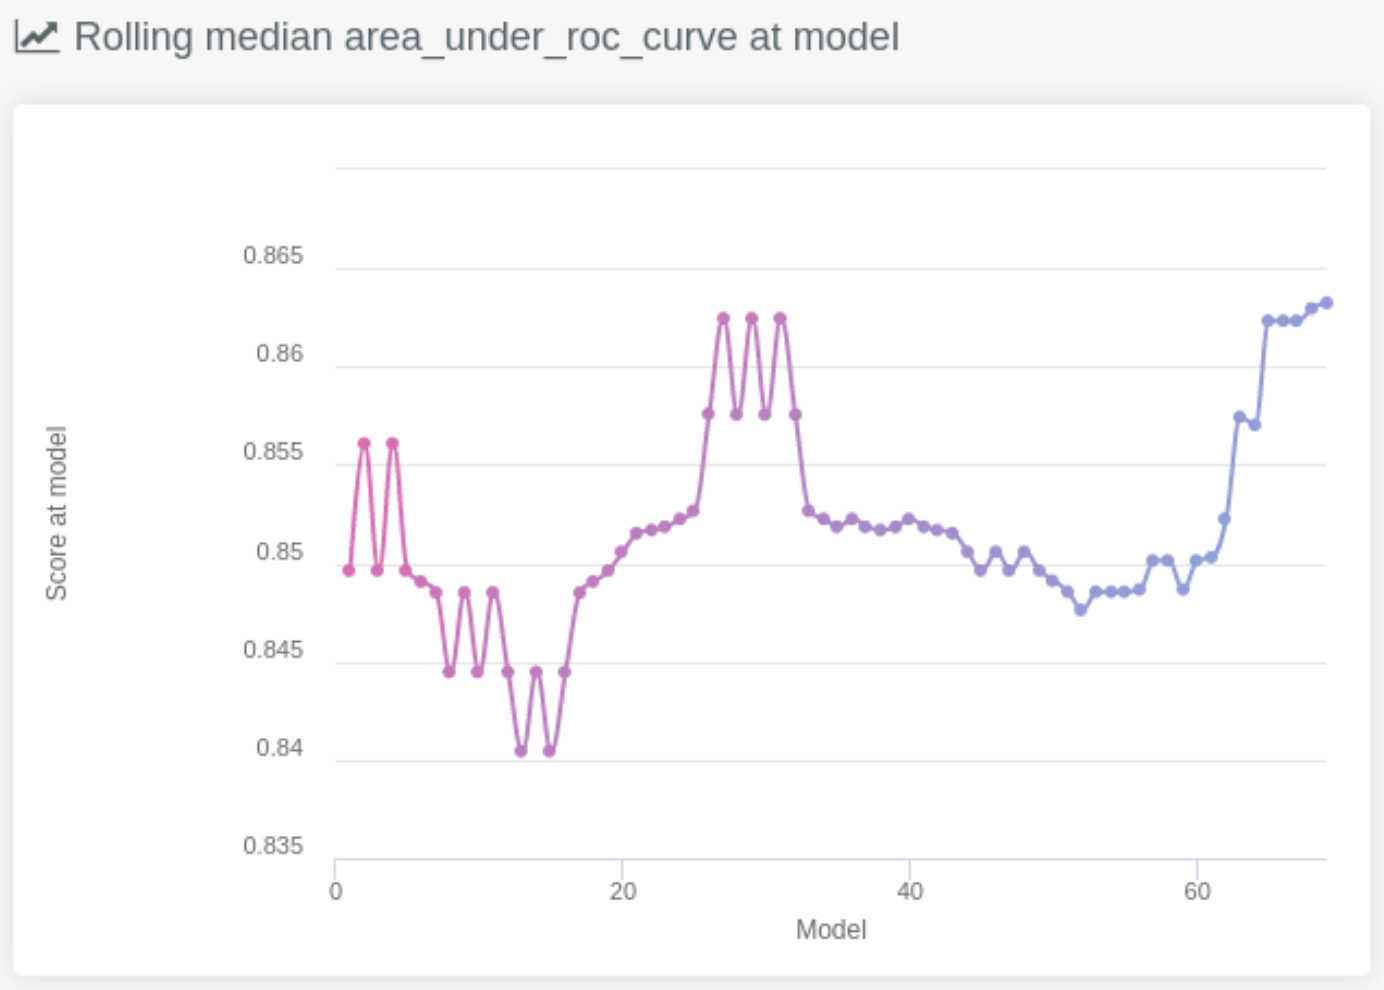
The sign we have hit upon a solution at (or close to) to the global optimal would be to see it flatten out into something like an asymptotic convergence (i.e. its rate of improvement has reached close to zero and it has remained steady for some time).
# What's next?
- Check out the leaderboard to compare models that have been created during training and publish them so you can make predictions.
- Explore the generated models in depth
- Start making predictions with the models
- Explain the models to understand their key drivers
- Stop training, customise the code, start training again and observe the differences