# Google Sheets
The API page for a deployment also explains how to integrate model predictions directly into Google Sheets. Below is a formula that can be pasted into Google Sheets to get predictions on some rows of data that correspond to what the Titanic model expects as inputs.

In this formula string, the value of probabilities is set to true by default.
- If
probabilities=true, then the formula will fetch theyhat_probsof the row prediction against the positive class, which in this case isSurvived=1. - If
probabilities=false, then the formula will fetch the predicted label for the row.
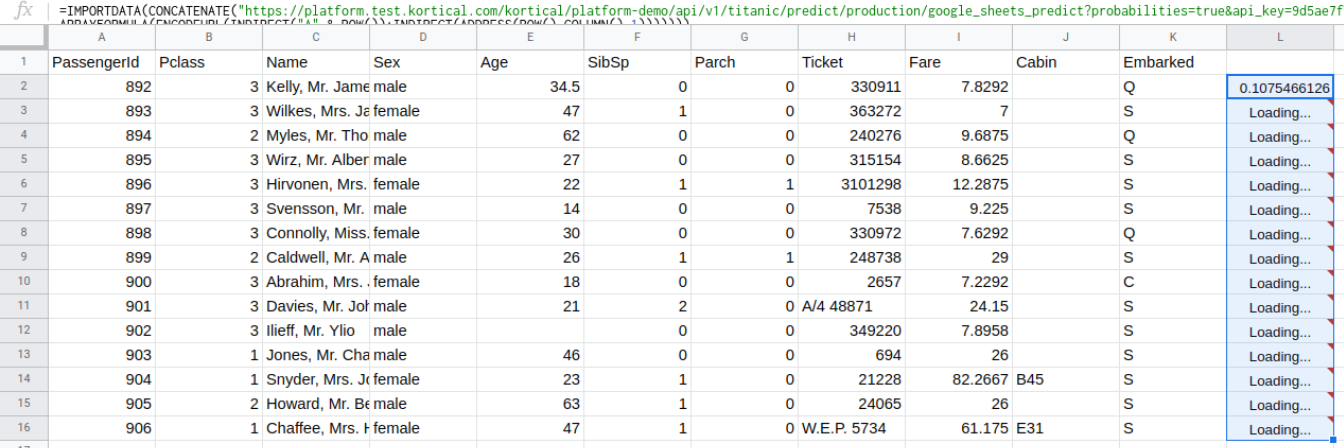
In this image, the user has pasted in the formula with probabilities=true into cell L2 and then dragged that down through
the L column to apply it to all the rows. This shows the probabilities getting calculated.
If we were to then apply the same but with probabilities=false to M column, we would end up with
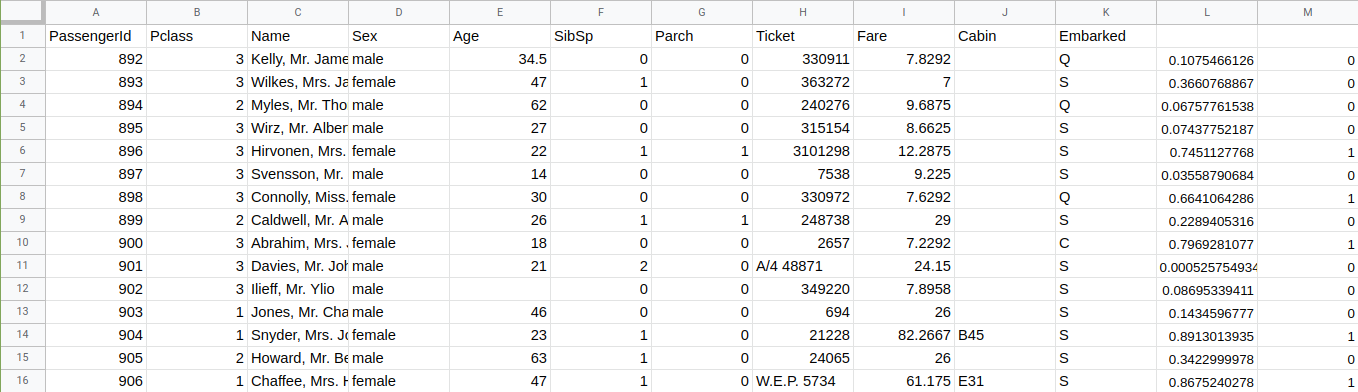
- Column L contains the
yhat_probsfor each row. - Column M contains the
yhatlabels for each row.